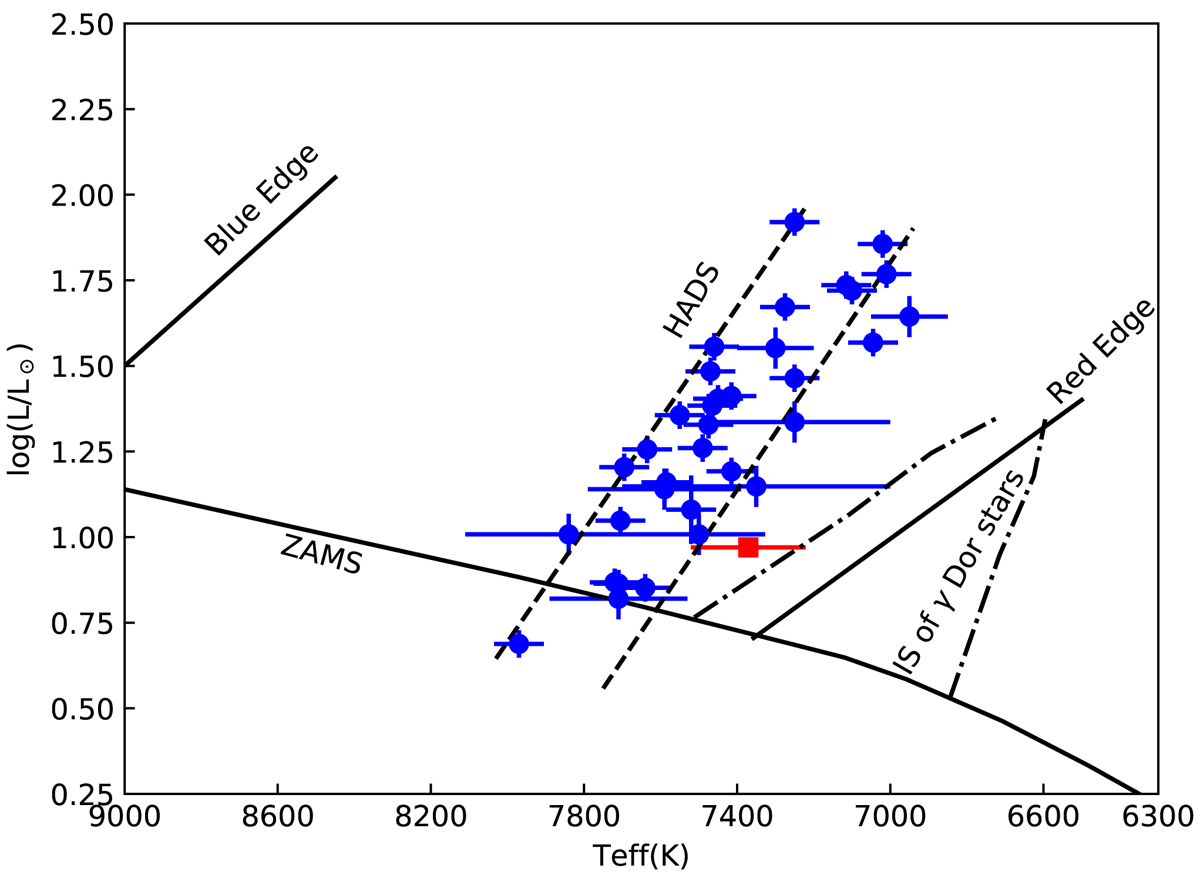
Fig. 5.
Download original image
Location of the 34 well-studied HADS and TIC 308396022 in the H-R Diagram. TIC 308396022 is shown as the red square. The blue dots are the HADS collected from McNamara (2000), Poretti et al. (2005, 2011), Christiansen et al. (2007), Balona et al. (2012), Ulusoy et al. (2013), Peña et al. (2016), Yang et al. (2018), Yang & Esamdin (2019), Bowman et al. (2021). The zero-age main-sequence (ZAMS) and the δ Sct instability strip (solid lines) are from Murphy et al. (2019). The dashed lines show the region occupied by HADS, as found by McNamara (2000). The theoretical instability strip (IS) of γ Dor stars (dotted-dashed lines) is from Dupret et al. (2005b).
Current usage metrics show cumulative count of Article Views (full-text article views including HTML views, PDF and ePub downloads, according to the available data) and Abstracts Views on Vision4Press platform.
Data correspond to usage on the plateform after 2015. The current usage metrics is available 48-96 hours after online publication and is updated daily on week days.
Initial download of the metrics may take a while.