Free Access
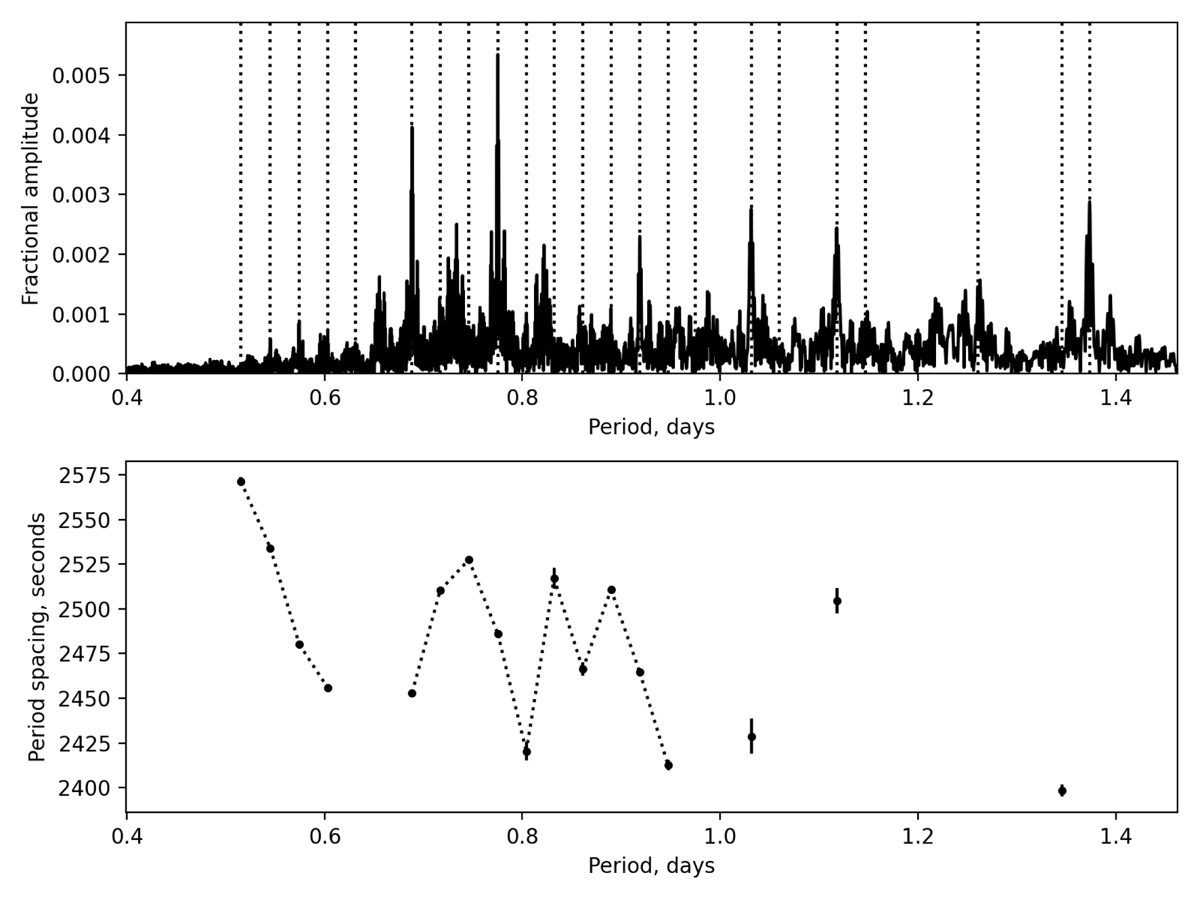
Fig. 4.
Download original image
Amplitude spectrum and period spacing patterns of TIC 308396022. Upper panel: amplitude spectrum with x-axis of period. The vertical dashed lines show the locations of the g modes in the period spacing patterns. Lower panel: period spacing pattern. The dots are the period spacings between the adjacent modes.
Current usage metrics show cumulative count of Article Views (full-text article views including HTML views, PDF and ePub downloads, according to the available data) and Abstracts Views on Vision4Press platform.
Data correspond to usage on the plateform after 2015. The current usage metrics is available 48-96 hours after online publication and is updated daily on week days.
Initial download of the metrics may take a while.