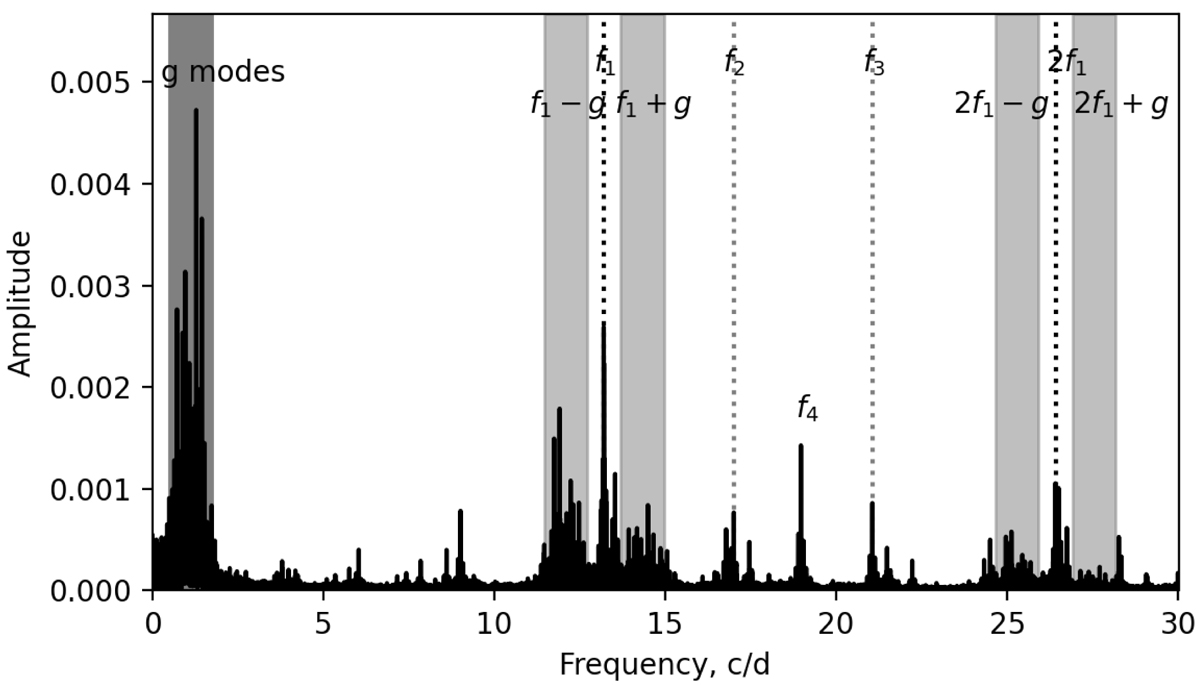
Fig. 2.
Download original image
Amplitude spectrum of TIC 308396022, with the fundamental mode removed. The vertical dark-gray dotted line marks the location of the fundamental mode f1, and the light-gray dotted lines mark the first and the second overtones, f2 and f3. The dark shaded area shows the g-mode region, while the light shaded areas around f1 and 2f1 show the combinations between the fundamental mode and the g modes: f1 + g, f1 − g, 2f1 + g, and 2f1 − g.
Current usage metrics show cumulative count of Article Views (full-text article views including HTML views, PDF and ePub downloads, according to the available data) and Abstracts Views on Vision4Press platform.
Data correspond to usage on the plateform after 2015. The current usage metrics is available 48-96 hours after online publication and is updated daily on week days.
Initial download of the metrics may take a while.