Open Access
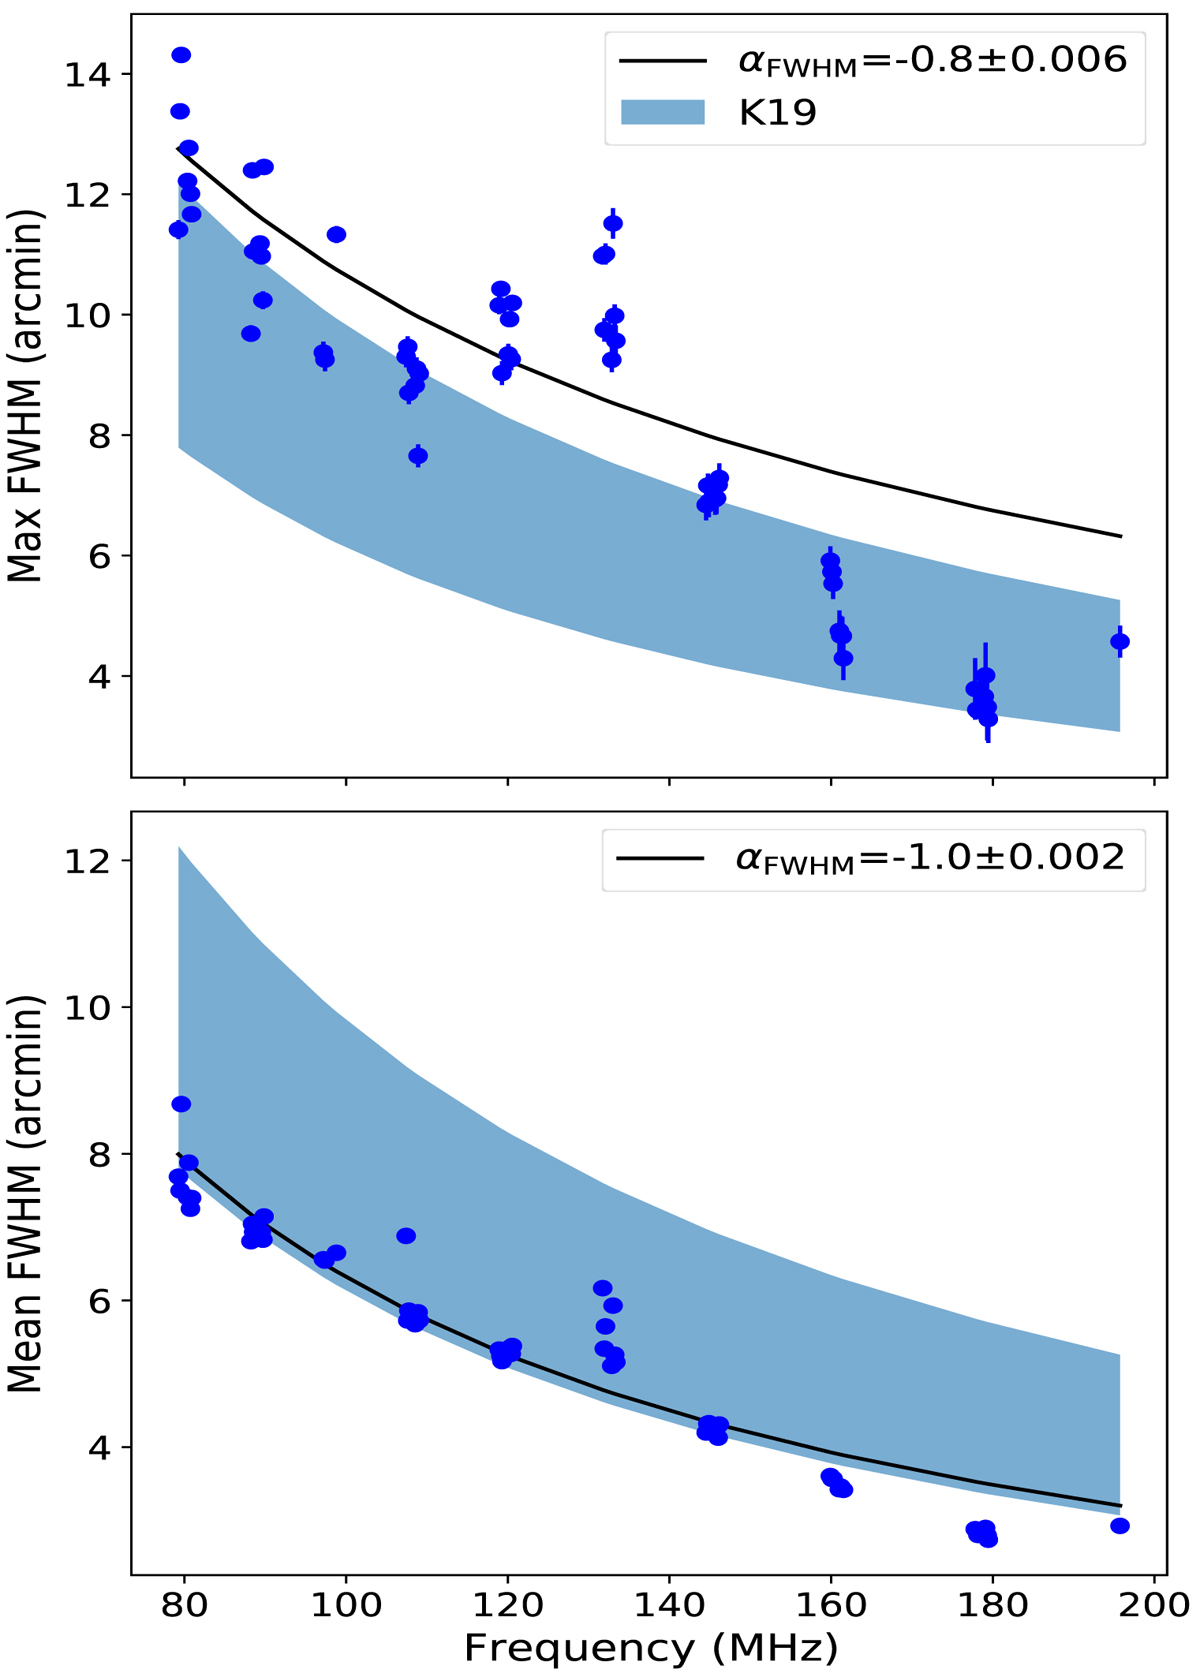
Fig. 6.
Download original image
Maximum and mean FWHM observed for the burst source across time at each observation frequency. Solid lines show the power-law fits to the data, and the shaded region shows the expected range of source sizes based on the K19 results.
Current usage metrics show cumulative count of Article Views (full-text article views including HTML views, PDF and ePub downloads, according to the available data) and Abstracts Views on Vision4Press platform.
Data correspond to usage on the plateform after 2015. The current usage metrics is available 48-96 hours after online publication and is updated daily on week days.
Initial download of the metrics may take a while.