Open Access
Fig. 2.
Download original image
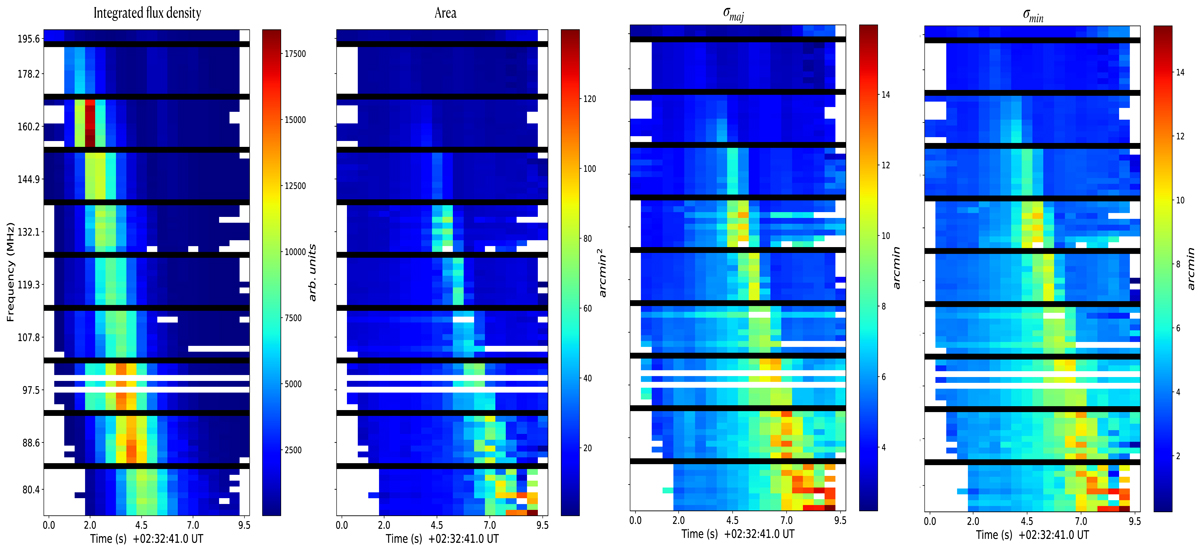
SPREDS for different burst source properties. The black horizontal lines mark the edges of the spectral bands. White regions are masked due to bad data (usually in frequencies above 140 MHz) or due to the absence of a bright Gaussian burst source.
Current usage metrics show cumulative count of Article Views (full-text article views including HTML views, PDF and ePub downloads, according to the available data) and Abstracts Views on Vision4Press platform.
Data correspond to usage on the plateform after 2015. The current usage metrics is available 48-96 hours after online publication and is updated daily on week days.
Initial download of the metrics may take a while.