Fig. 1.
Download original image
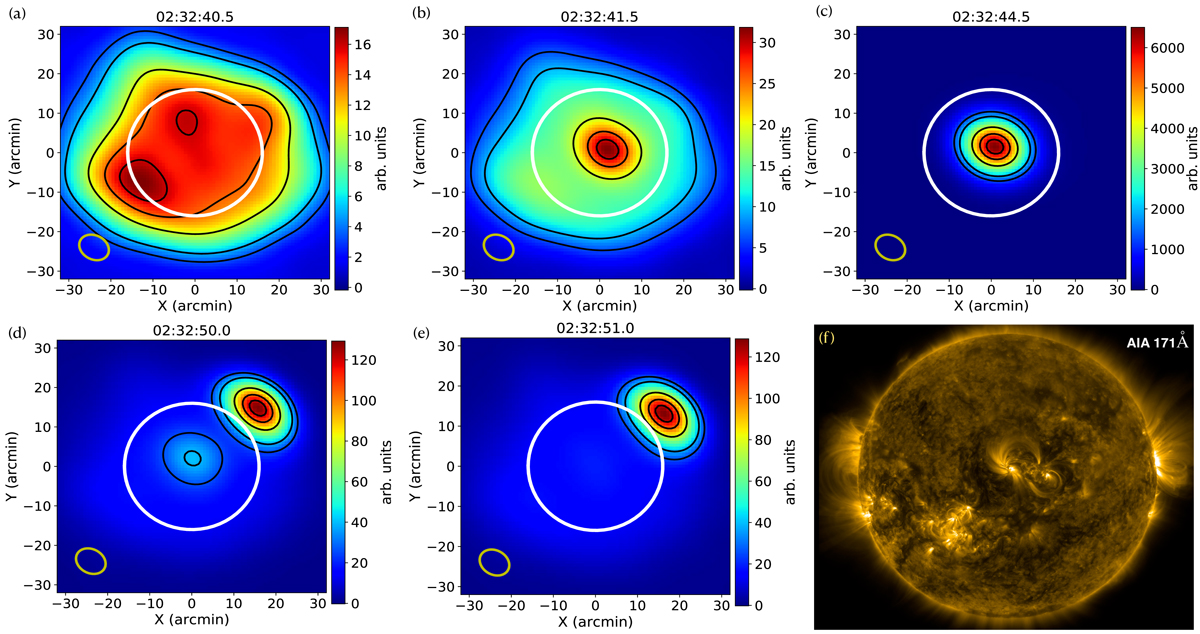
(a–e): 109 MHz images during different times: (a) just before the start, (b) at the start, (c) at the peak, (d) towards the end, and (e) after the end of the burst. The images are at the same arbitrary unit scale. Image contours show 20%, 30%, 60%, 80%, and 93% of the peak. The synthesised beam ellipse is shown in the bottom-left corner of the images. The white circle marks the optical disk. (f): AIA 171Å image at 02:32:00 UT, showing a bright active region at the disk centre during the burst.
Current usage metrics show cumulative count of Article Views (full-text article views including HTML views, PDF and ePub downloads, according to the available data) and Abstracts Views on Vision4Press platform.
Data correspond to usage on the plateform after 2015. The current usage metrics is available 48-96 hours after online publication and is updated daily on week days.
Initial download of the metrics may take a while.