Fig. 8.
Download original image
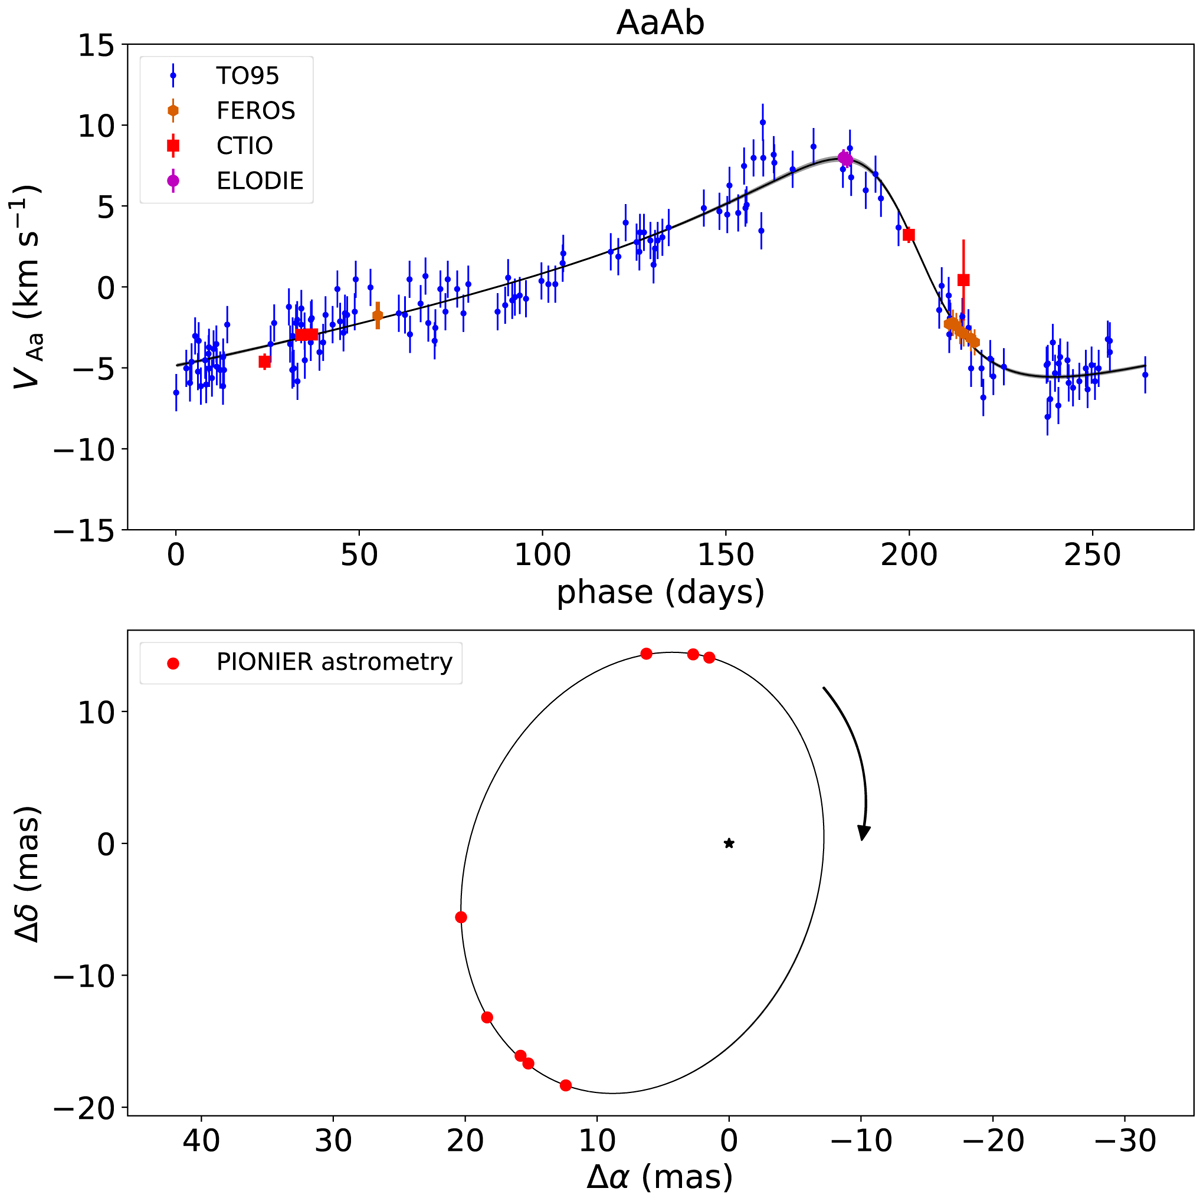
Best orbital solution for AaAb. In both panels, the solid line corresponds to the best-fit model. Bottom panel: the primary star Aa is located at the origin. The relative positions of Ab are plotted as filled dots; the error ellipses from PIONIER astrometry are smaller than the marker. Upper panel: the coloured markers correspond to the primary star RV measurements. The systematic velocity γ for each set of observations was subtracted.
Current usage metrics show cumulative count of Article Views (full-text article views including HTML views, PDF and ePub downloads, according to the available data) and Abstracts Views on Vision4Press platform.
Data correspond to usage on the plateform after 2015. The current usage metrics is available 48-96 hours after online publication and is updated daily on week days.
Initial download of the metrics may take a while.