Free Access
Fig. 3.
Download original image
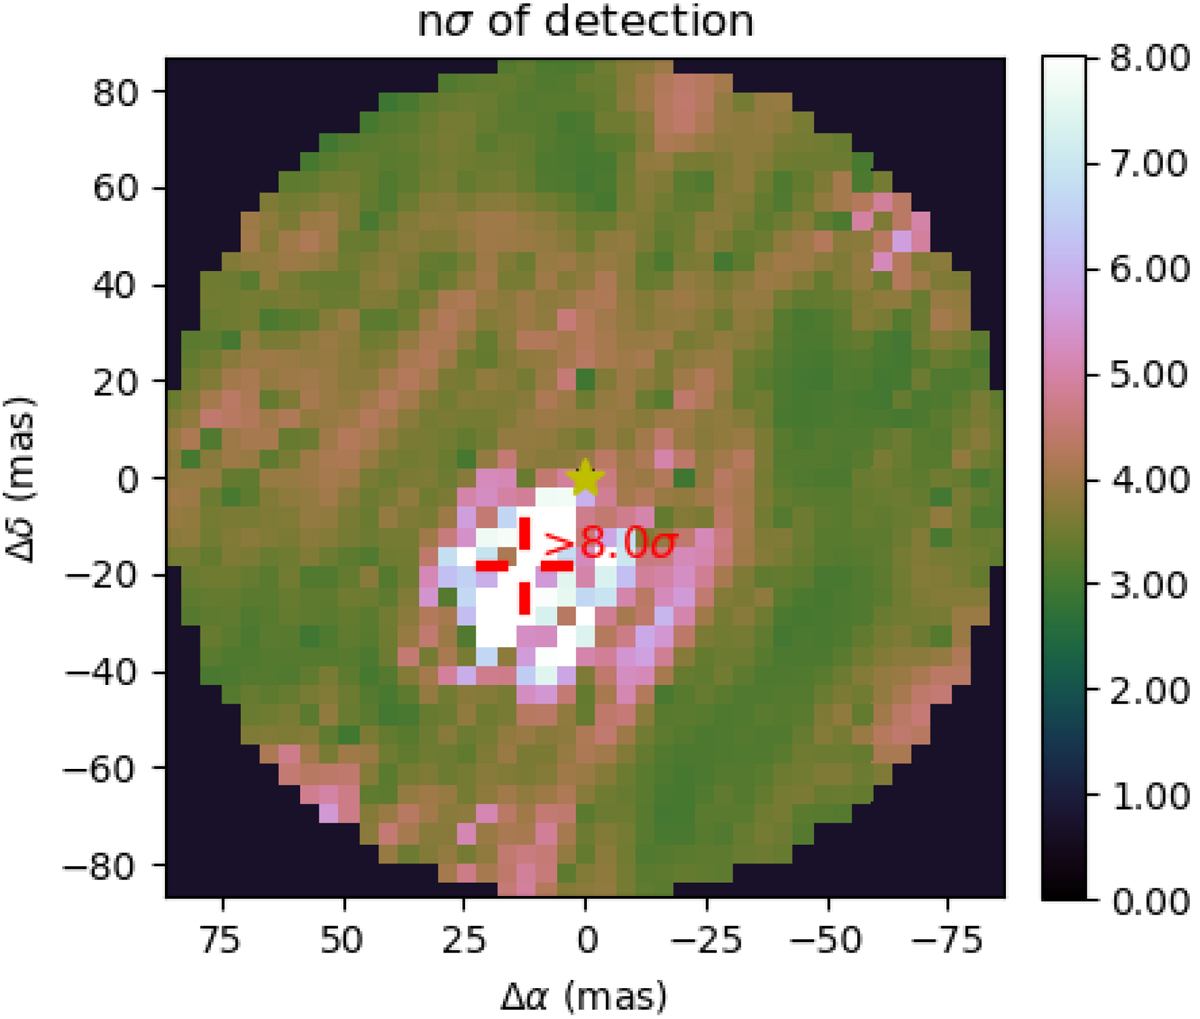
Detection level map from CANDID for the observation of AaAb taken in April 2019. The colourbar shows the significance of the companion detection in the number of sigmas. The red cross points to the best-fit position.
Current usage metrics show cumulative count of Article Views (full-text article views including HTML views, PDF and ePub downloads, according to the available data) and Abstracts Views on Vision4Press platform.
Data correspond to usage on the plateform after 2015. The current usage metrics is available 48-96 hours after online publication and is updated daily on week days.
Initial download of the metrics may take a while.