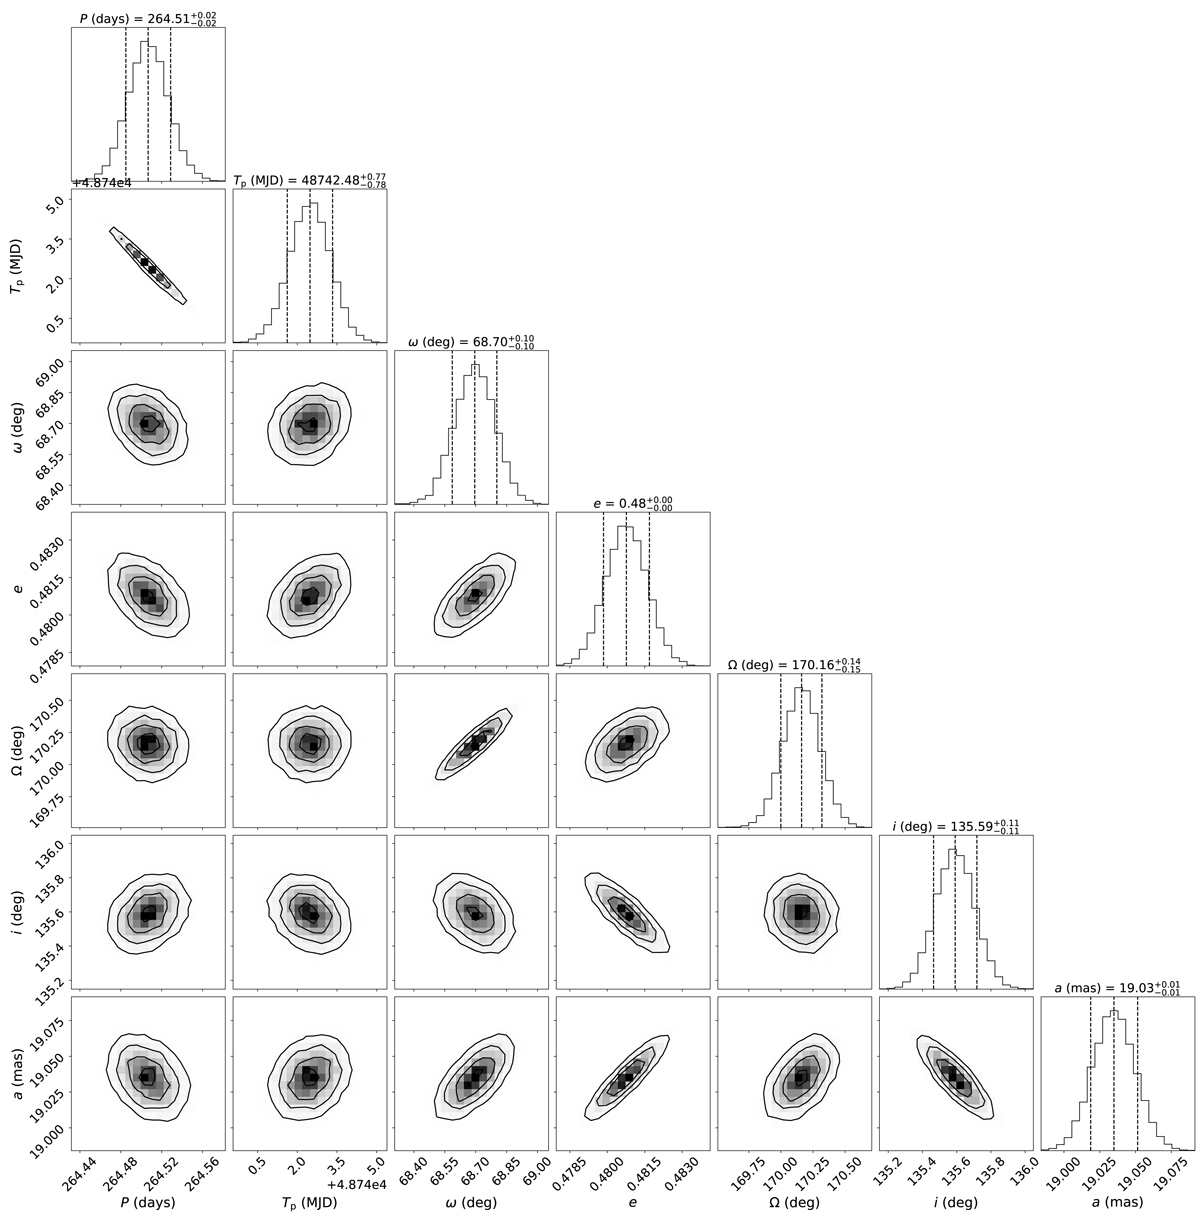
Fig. B.2.
Download original image
Posterior samples of AaAb orbital parameters. Contoured sub-panels show the distribution of points from the MCMC chains, where high-density regions are indicated by the greyscale and contours. Histogram sub-panels show the posterior distributions, with median and 68% confidence intervals marked by dashed lines, with titles quantifying those ranges.
Current usage metrics show cumulative count of Article Views (full-text article views including HTML views, PDF and ePub downloads, according to the available data) and Abstracts Views on Vision4Press platform.
Data correspond to usage on the plateform after 2015. The current usage metrics is available 48-96 hours after online publication and is updated daily on week days.
Initial download of the metrics may take a while.