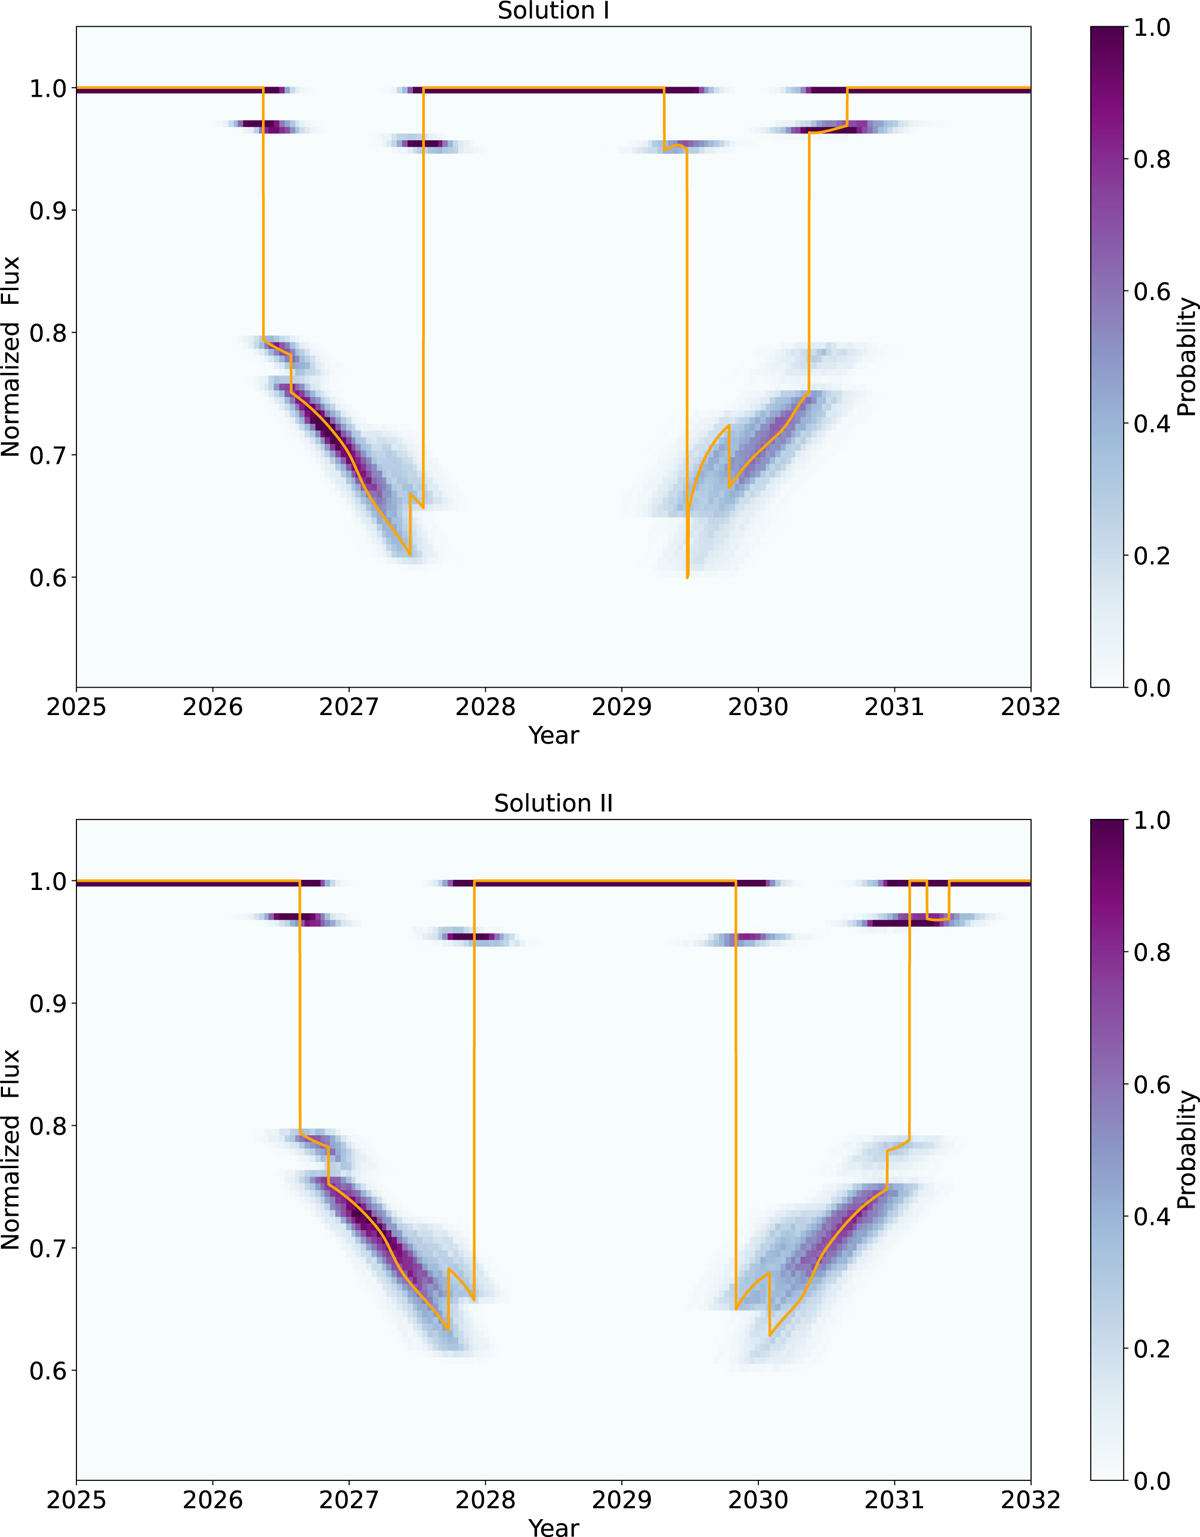
Fig. 13.
Download original image
Probability density plot of 1000 realizations of the light curve for the occultation of AaAb behind the disk surrounding BaBb for solutions I and II (top and bottom, respectively). The colour bar shows the probability of getting a determined flux at a given time, such that the sum along each of the columns is normalised to unity. In orange we show the light curve for the best-fit parameters (Table 4).
Current usage metrics show cumulative count of Article Views (full-text article views including HTML views, PDF and ePub downloads, according to the available data) and Abstracts Views on Vision4Press platform.
Data correspond to usage on the plateform after 2015. The current usage metrics is available 48-96 hours after online publication and is updated daily on week days.
Initial download of the metrics may take a while.