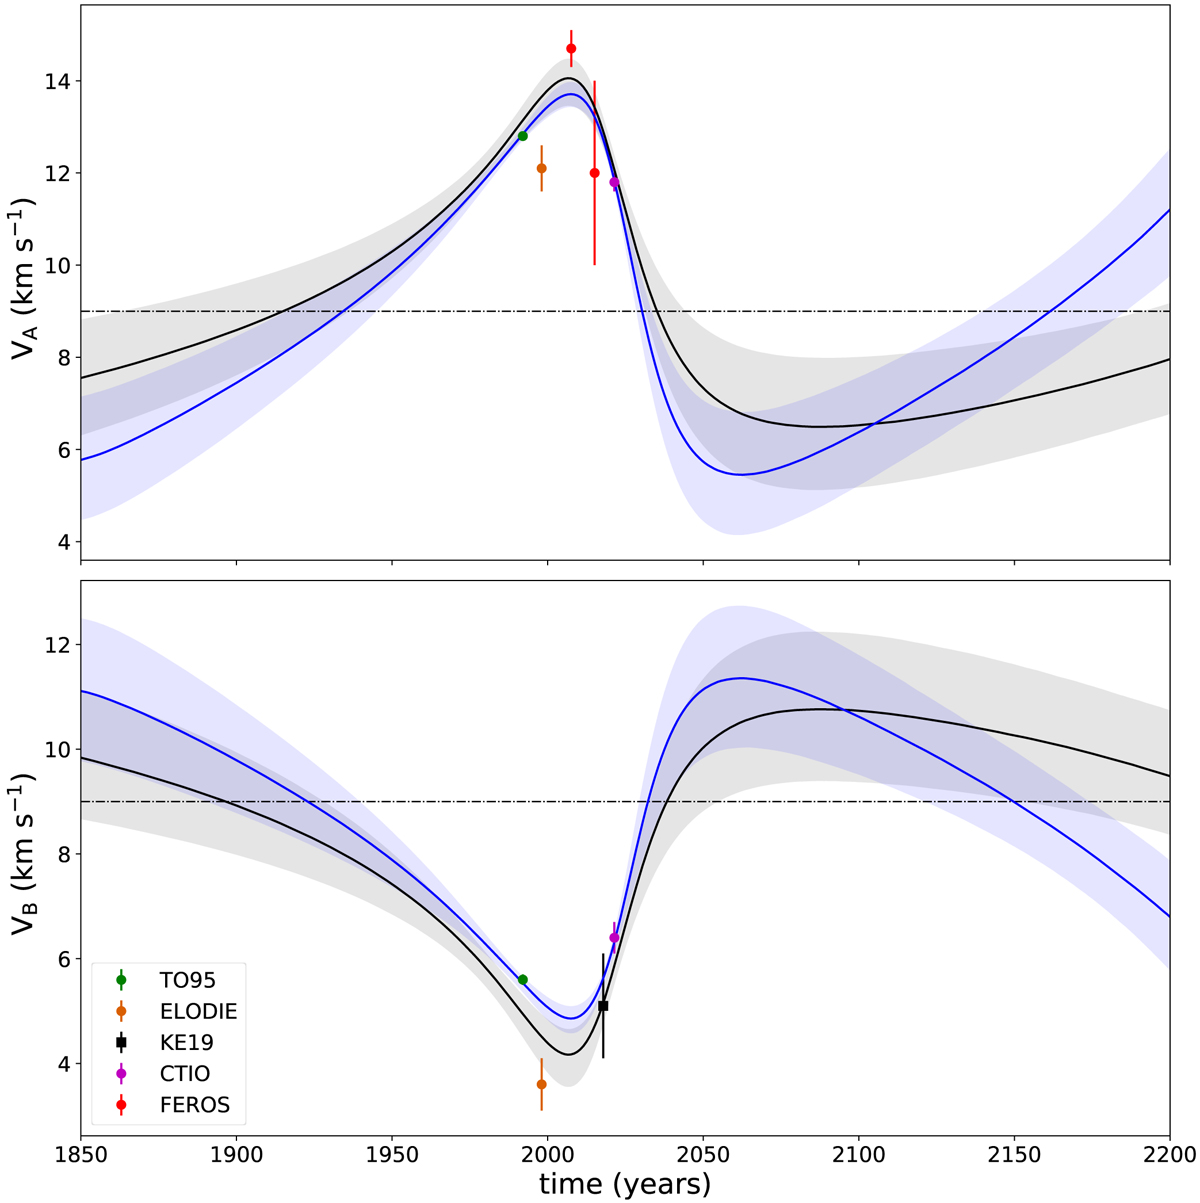
Fig. 11.
Download original image
Best orbital solution for AB outer orbit for both uncertainty assumptions in the astrometry before 1991. In both panels the solid line corresponds to the best fit model and the shaded area to the 1σ region. The solid black lines correspond to the best orbital solution assuming small uncertainties (σ ∼ 0.02″) and the blue ones assume large uncertainties (σ ∼ 0.1″). The dots markers correspond to the RV measurement of systemic velocities from our orbital solutions and the one obtained from CO modelling.
Current usage metrics show cumulative count of Article Views (full-text article views including HTML views, PDF and ePub downloads, according to the available data) and Abstracts Views on Vision4Press platform.
Data correspond to usage on the plateform after 2015. The current usage metrics is available 48-96 hours after online publication and is updated daily on week days.
Initial download of the metrics may take a while.