Free Access
Fig. A.1
Download original image
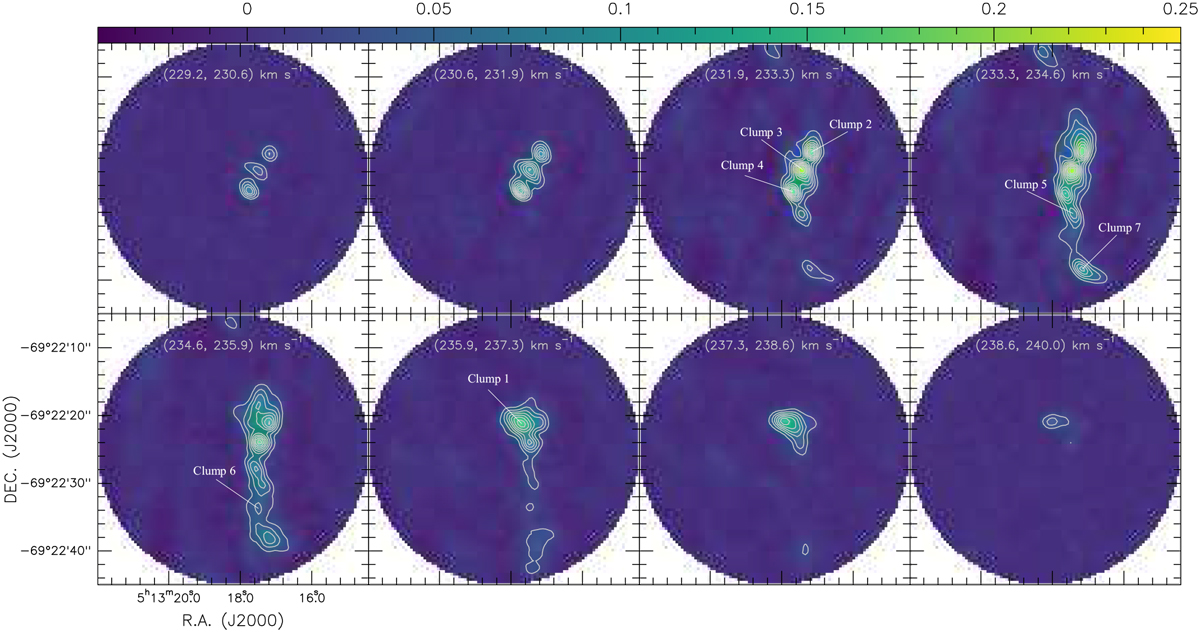
Para-H2CO 303–202 channel maps of N113. The contour levels are from 10% to 100% with steps of 10% of the peak intensity (0.25 Jy beam−1; color bar in units of Jy beam−1). The centers of the fields are given in Fig. 1. Angular scales of 4″ correspond to a linear scale of ~1 pc. No primary beam correction has been applied.
Current usage metrics show cumulative count of Article Views (full-text article views including HTML views, PDF and ePub downloads, according to the available data) and Abstracts Views on Vision4Press platform.
Data correspond to usage on the plateform after 2015. The current usage metrics is available 48-96 hours after online publication and is updated daily on week days.
Initial download of the metrics may take a while.