Free Access
Fig. 7
Download original image
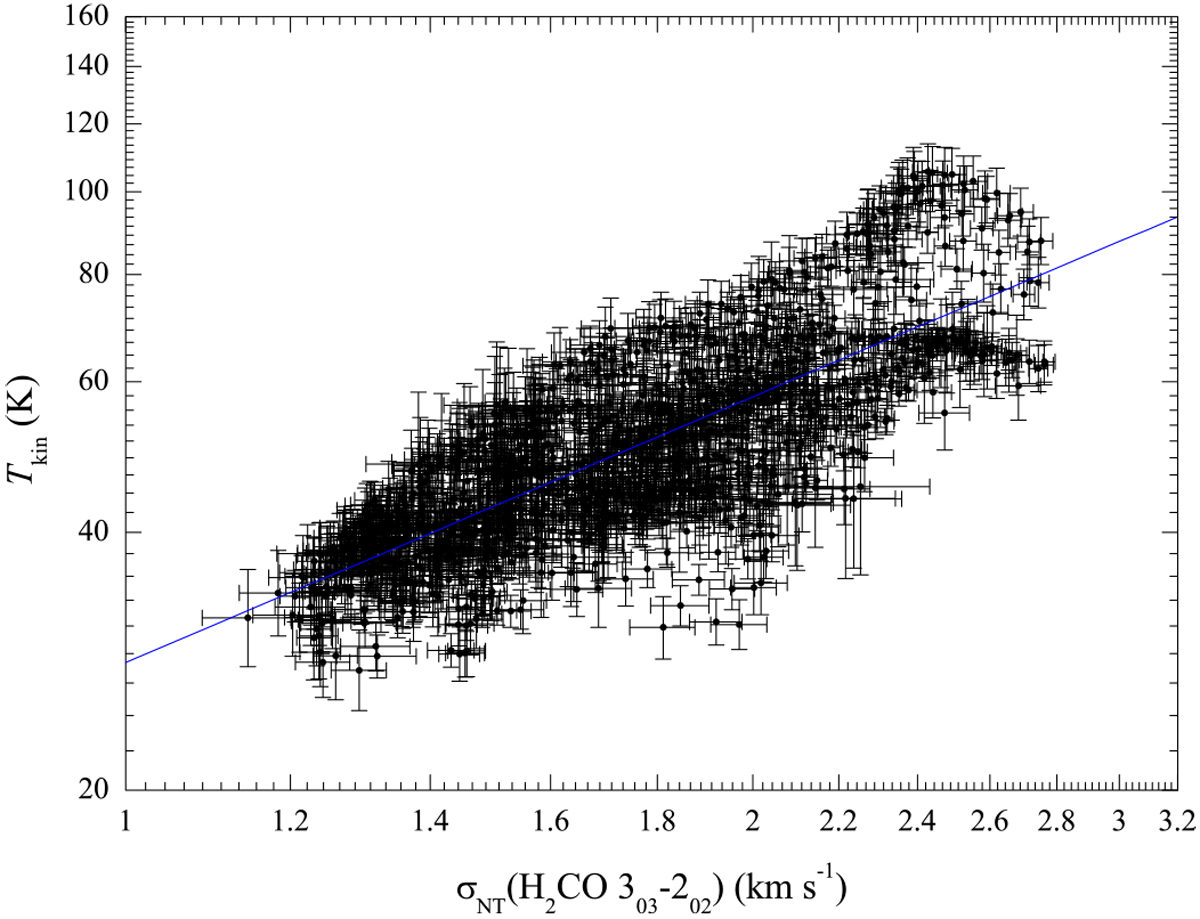
Non thermal velocity dispersion (σNT) vs. gas kinetic temperature derived from the para-H2CO line ratio for locations (pixels) with the Mach number ![]() ≳ 3.5 in N113. Theblue line is the result from an unweighed linear fit, logTkin = (1.03 ± 0.02) ×logσNT + (1.45 ± 0.01), with a correlation coefficient, R, of 0.78.
≳ 3.5 in N113. Theblue line is the result from an unweighed linear fit, logTkin = (1.03 ± 0.02) ×logσNT + (1.45 ± 0.01), with a correlation coefficient, R, of 0.78.
Current usage metrics show cumulative count of Article Views (full-text article views including HTML views, PDF and ePub downloads, according to the available data) and Abstracts Views on Vision4Press platform.
Data correspond to usage on the plateform after 2015. The current usage metrics is available 48-96 hours after online publication and is updated daily on week days.
Initial download of the metrics may take a while.