Fig. 6
Download original image
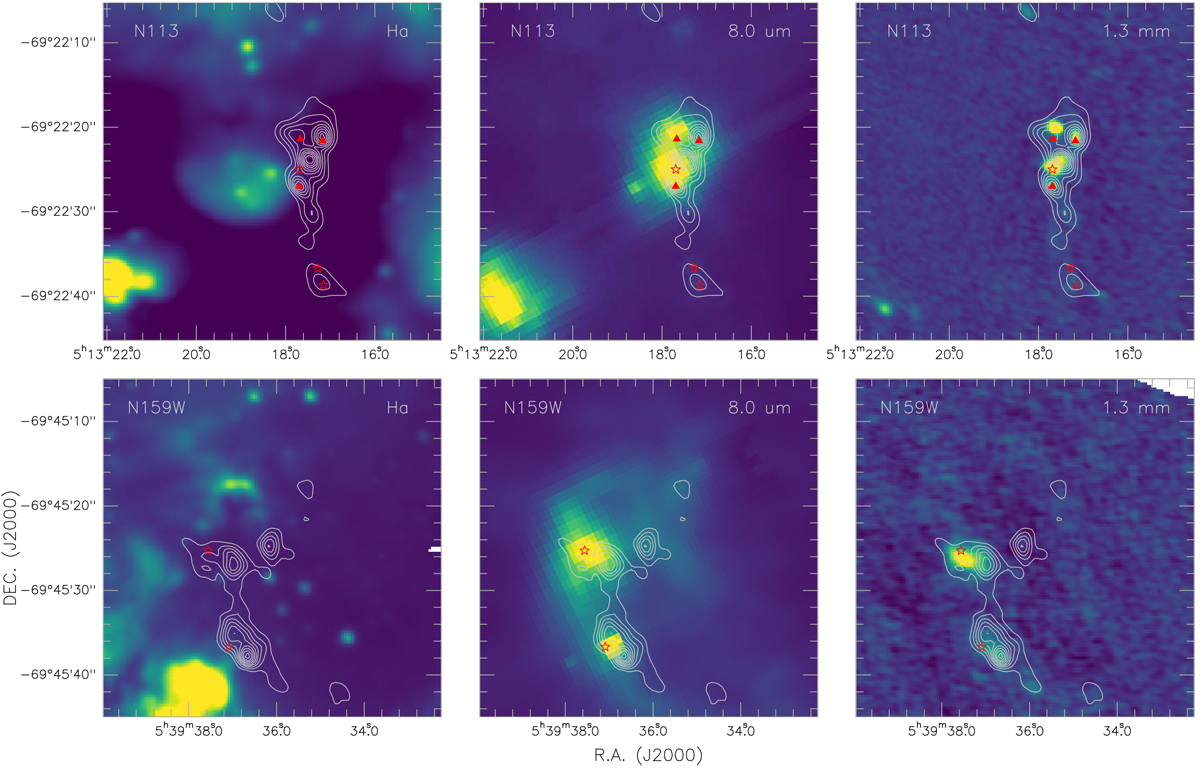
Para-H2CO (303 –202) with integrated intensity contours (same as Fig. 1) overlaid on Hα (left panels; Smith & MCELS Team 1998), Spitzer 8.0 μm (middle panels; Meixner et al. 2006), and 1.3 mm continuum (right panels; observed with ALMA Band 6; Fukui et al. 2015; Sewiło et al. 2018) images of N113 (top panels) and N159W (bottom panels). Stars and triangles show the locations of the YSOs (or YSO candidates) and H2O masers (Chen et al. 2010; Ellingsen et al. 2010; Carlson et al. 2012), respectively.
Current usage metrics show cumulative count of Article Views (full-text article views including HTML views, PDF and ePub downloads, according to the available data) and Abstracts Views on Vision4Press platform.
Data correspond to usage on the plateform after 2015. The current usage metrics is available 48-96 hours after online publication and is updated daily on week days.
Initial download of the metrics may take a while.