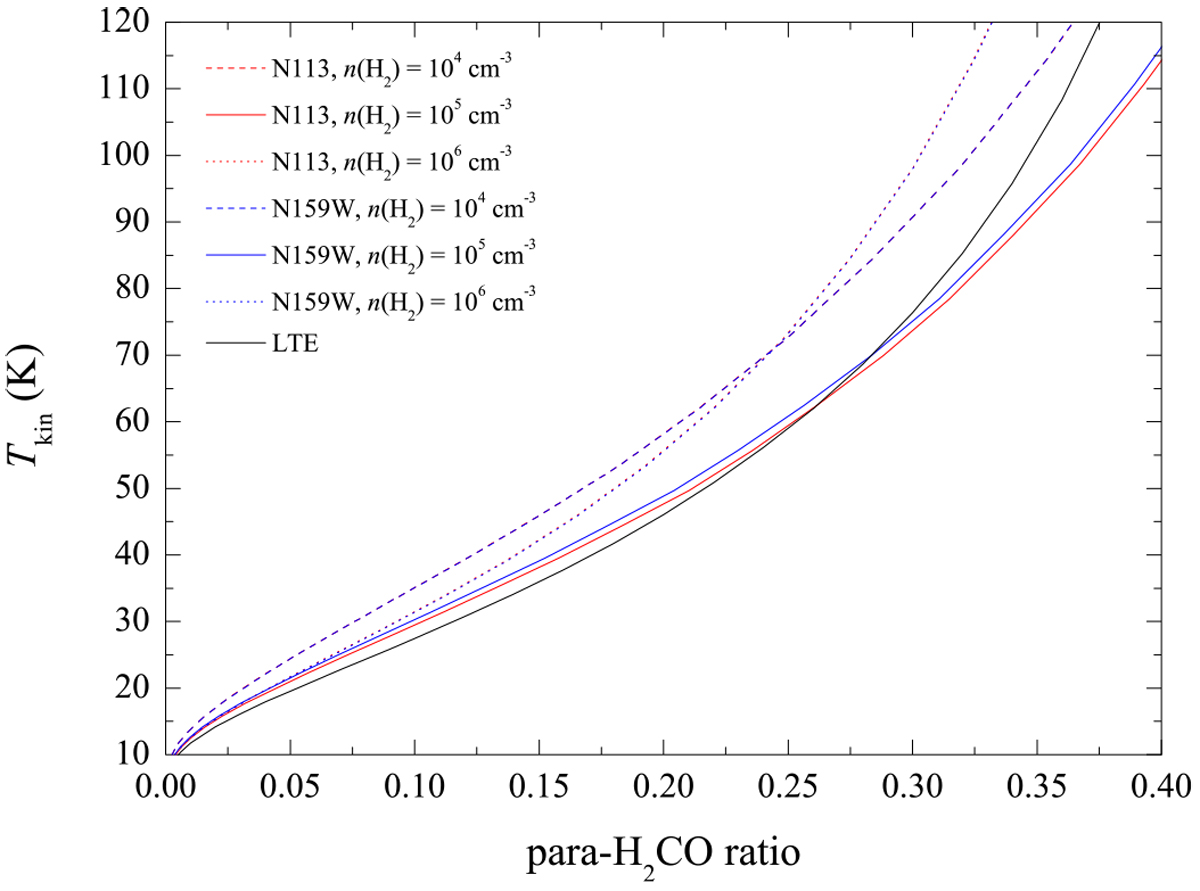
Fig. 5
Download original image
RADEX non-LTE (red and blue lines) and LTE (black line) modeling of the relation between kinetic temperature and average ratio of para-H2CO 322–221/303–202 and 321 –220/303–202 with spatial densities of n(H2) = 104, 105, and 106 cm−3 (dashed,solid, and dotted lines, respectively), an averaged observed linewidth of 4.0 km s−1, and column densities of N(para-H2CO) = 2.7 × 10¹² and 3.7 × 1012 cm−2 for N113 (red lines) and N159W (blue lines) (Tang et al. 2017b), respectively. Tkin -Ratio(H2CO) relations for N113 and N159W at density 104 cm−3 are nearly the same, which is similar to the situation at 106 cm−3.
Current usage metrics show cumulative count of Article Views (full-text article views including HTML views, PDF and ePub downloads, according to the available data) and Abstracts Views on Vision4Press platform.
Data correspond to usage on the plateform after 2015. The current usage metrics is available 48-96 hours after online publication and is updated daily on week days.
Initial download of the metrics may take a while.