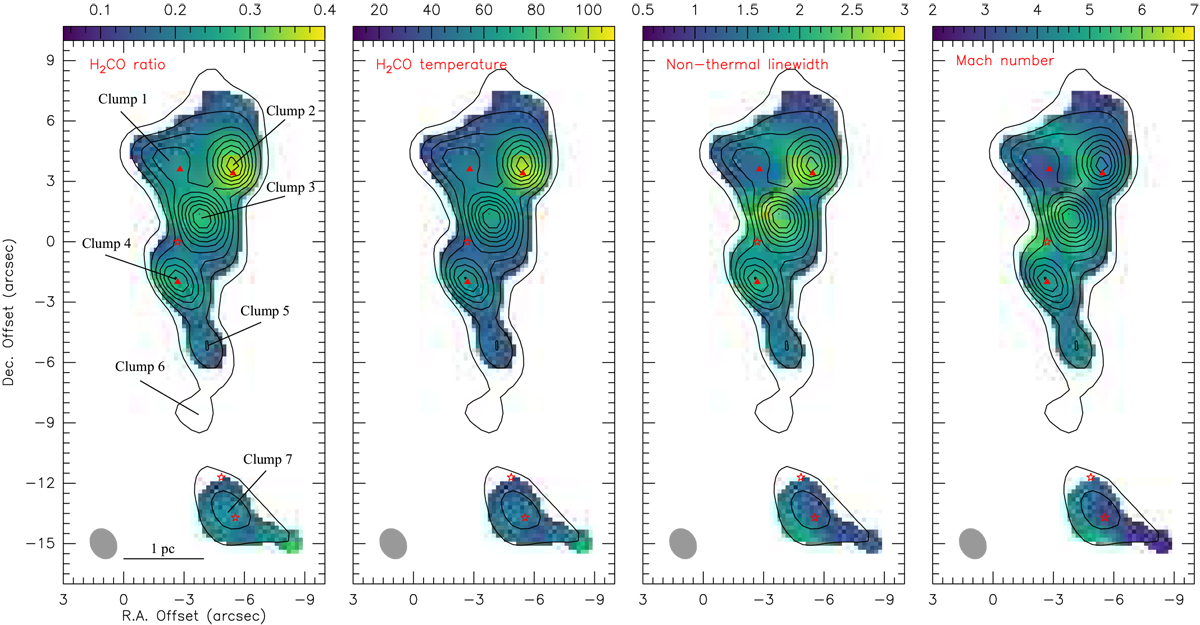
Fig. 3
Download original image
Left two panels: averaged velocity-integrated intensity ratio map of para-H2CO 0.5 × [(322–221 + 321–220)/303–202] in N113. Thekinetic temperatures derived from the para-H2CO (3–2) line ratios (color bar in units of Kelvin). Right two panels: maps of non thermal velocity dispersion (color bar in units of km s−1) and Mach number. Black contours show levels of integrated intensity of the para-H2CO (303–202) line (see Fig.1). Offsets are relative to our reference position for N113 (see Fig. 1). The pixel size of each image is 0.′′2 × 0.′′2. The beam size of each image is shown in the lower left corner. Stars and triangles show the locations of YSOs (or YSO candidates) and H2O masers (Chen et al. 2010; Ellingsen et al. 2010; Carlson et al. 2012), respectively.
Current usage metrics show cumulative count of Article Views (full-text article views including HTML views, PDF and ePub downloads, according to the available data) and Abstracts Views on Vision4Press platform.
Data correspond to usage on the plateform after 2015. The current usage metrics is available 48-96 hours after online publication and is updated daily on week days.
Initial download of the metrics may take a while.