Fig. 2
Download original image
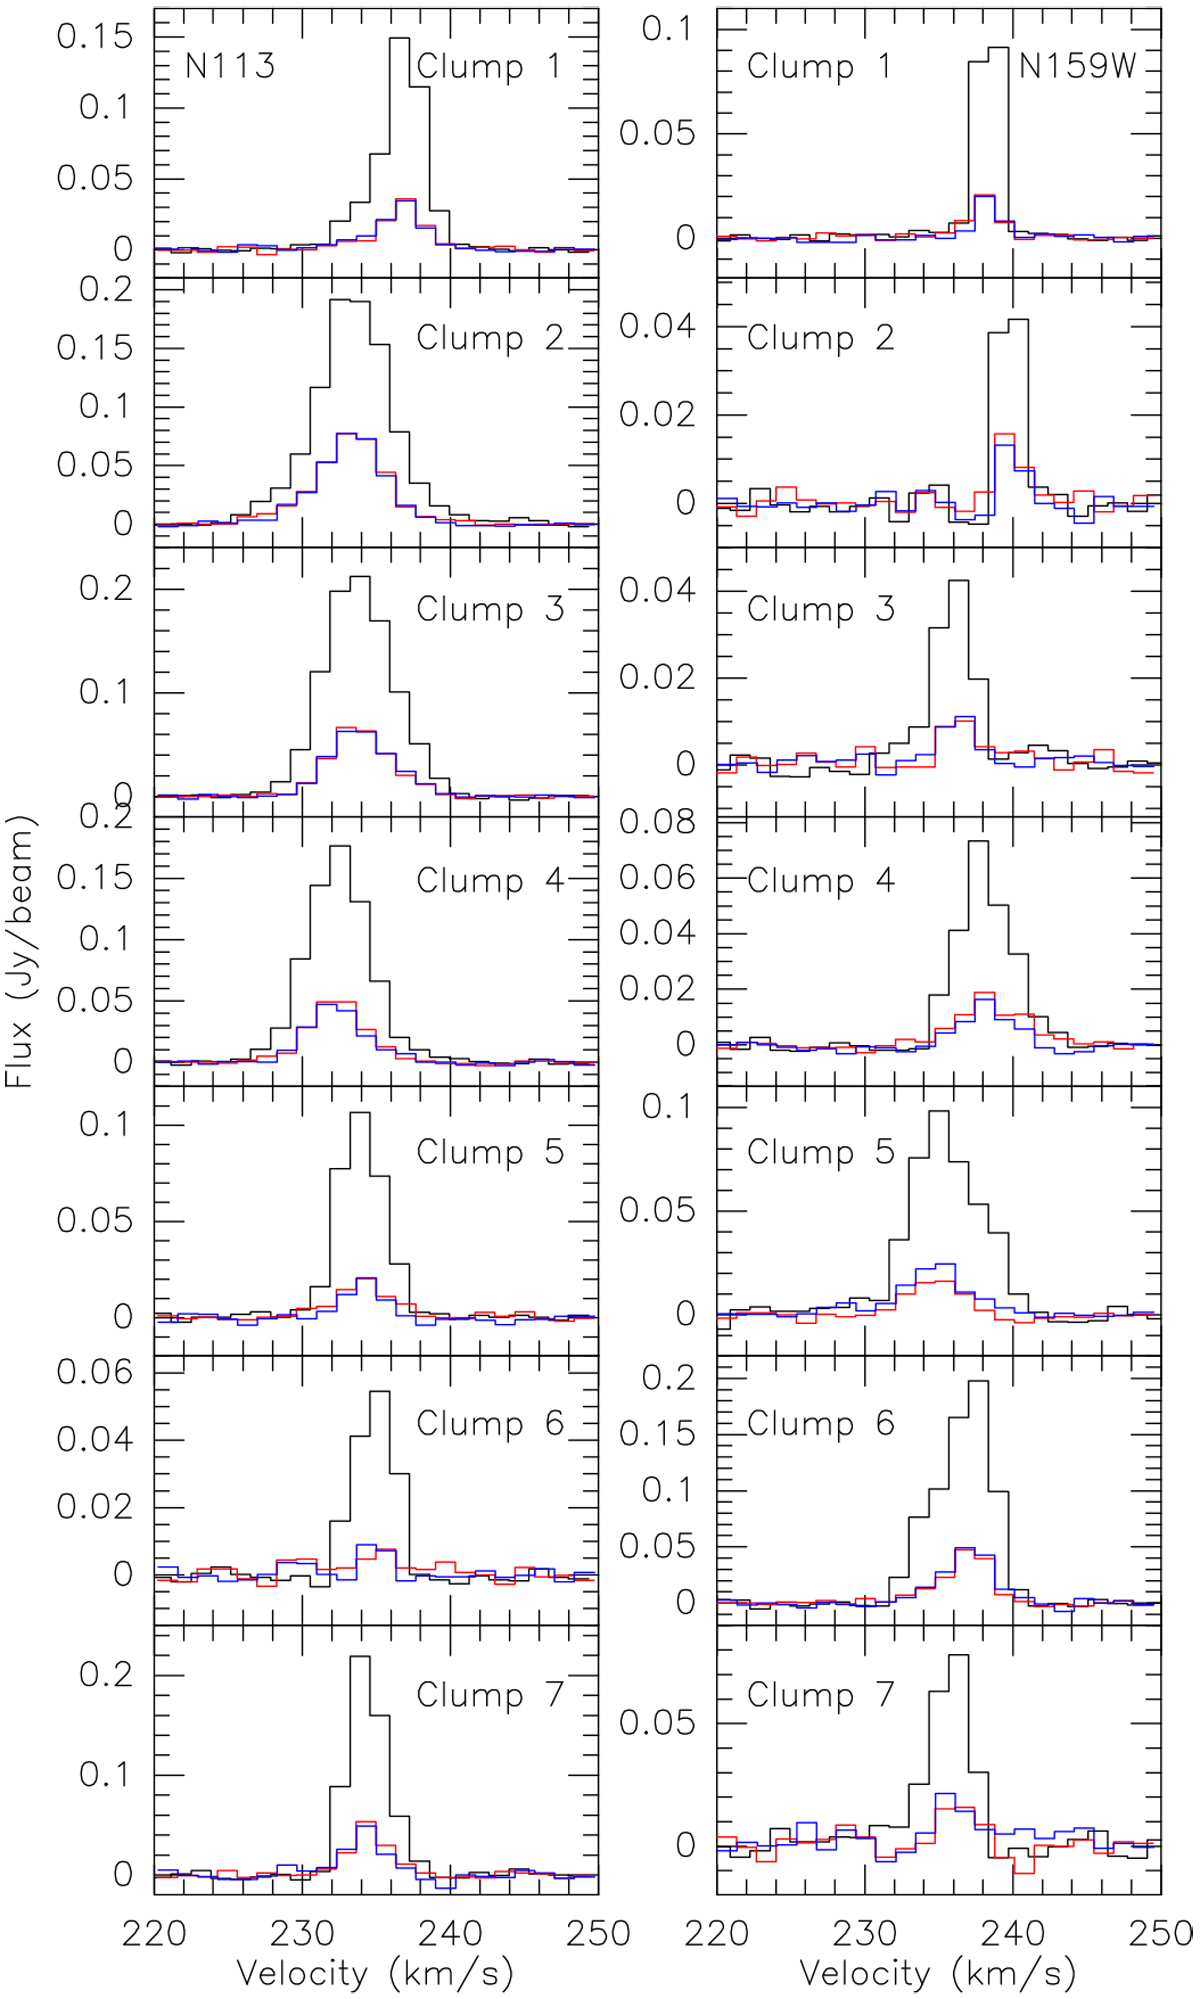
Spectra toward H2CO clumps in N113 (left panels) and N159W (right panels; see Table 2 and, for the numbering, the left panels of Figs. 3 and 4) taken from the strongest pixel obtained with ALMA. The pixel size is 0.′′ 2 × 0.′′2. Black: para-H2CO 303–202, red: para-H2CO 322–221, and blue: para-H2CO 321–220. The spectra are not smoothed, i.e., the channel widths are those given in Table 1.
Current usage metrics show cumulative count of Article Views (full-text article views including HTML views, PDF and ePub downloads, according to the available data) and Abstracts Views on Vision4Press platform.
Data correspond to usage on the plateform after 2015. The current usage metrics is available 48-96 hours after online publication and is updated daily on week days.
Initial download of the metrics may take a while.