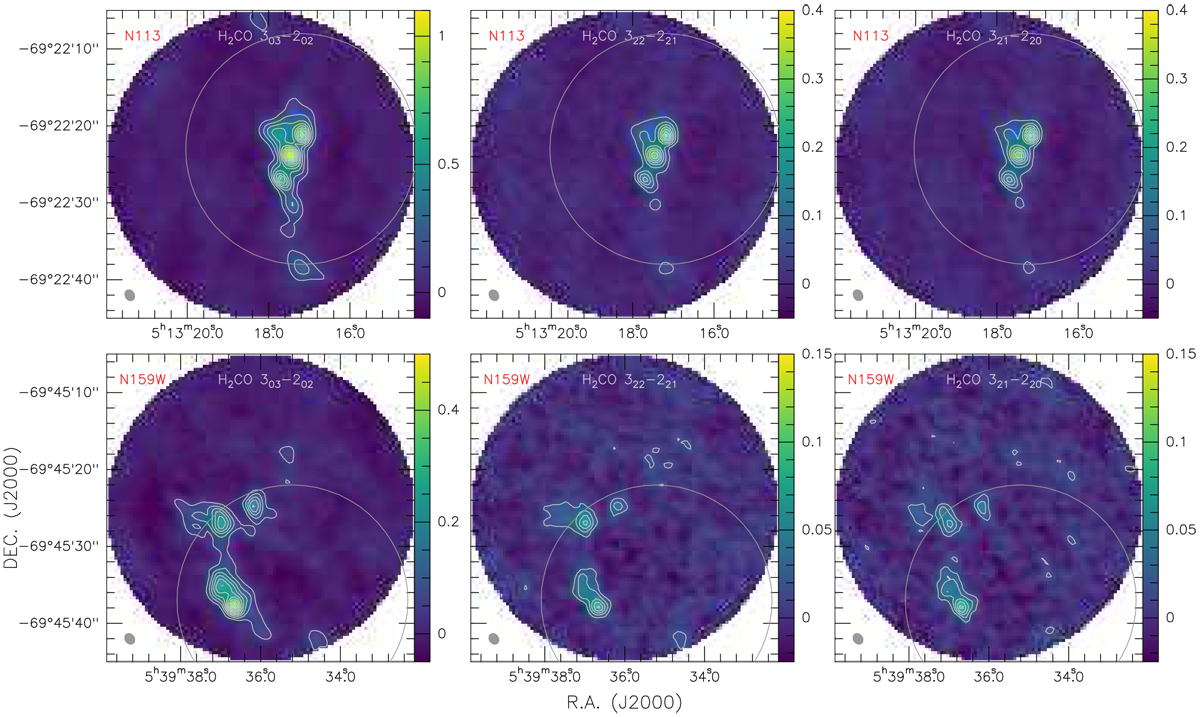
Fig. 1
Download original image
Velocity-integrated intensity maps (color bars in units of Jy beam−1 km s−1) of para-H2CO 303–202 (left panels),322–221 (central panels), and 321–220 (right panels) of N113 (integrated local standard of rest velocity range: 229–240 km s−1; top panels) and N159W (integrated velocity range: 232–244 km s−1; bottom panels). The centers of the fields are those also given in Sect. 2.2, i.e., α2000 = 05:13:18.2, δ2000 = –69:22:25.0 and α2000 = 05:39:36.0, δ2000 =– 69:45:25.0. The contours provide, with respect to the peak intensity, levels from 10 to 100% with steps of 10% (~10σ and ~7σ) for para-H2CO 303–202 in N113 and N159W, and from 10% to 100% with steps of 10% (~5σ) for para-H2CO 322-221 and 321 –220. The para-H2CO 303–202 peak intensities are 1.2 and 0.5 Jy beam−1 km s−1, the para-H2CO 322–221 peak intensities are 0.5 and 0.2 Jy beam−1 km s−1, and the para-H2CO 321–220 peak intensities are 0.5 and 0.2 Jy beam−1 km s−1 in N113 and N159W, respectively. The pixel size of each image is 0.′′2×0.′′2. The beam size of each image is shown in the lower left corner. Gray circles show the half power beam sizes of the N113 and N159W APEX-12m data, reported by Tang et al. (2017b). The shown fields of view encompass slightly more than our ALMA primary half power beam width (Sect. 2.2). No primary beam correction has been applied. Angular scales of 4″ correspond to a linear scale of ~1 pc.
Current usage metrics show cumulative count of Article Views (full-text article views including HTML views, PDF and ePub downloads, according to the available data) and Abstracts Views on Vision4Press platform.
Data correspond to usage on the plateform after 2015. The current usage metrics is available 48-96 hours after online publication and is updated daily on week days.
Initial download of the metrics may take a while.