Fig. 8
Download original image
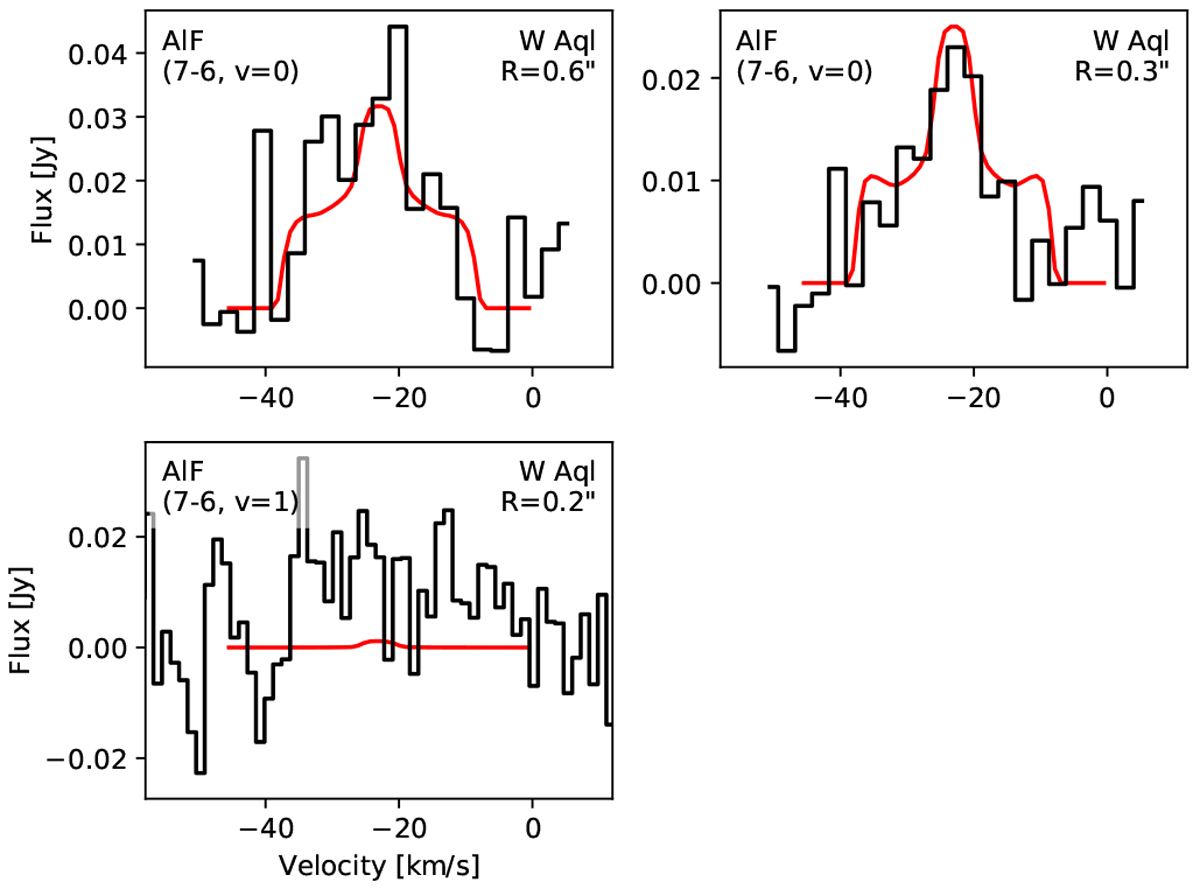
Azimuthally averaged radial profile of AlF, extracted from the ALMA (7 → 6) v = 0 line (black dotted lines and points with error bars) plotted with the corresponding modelled radial profiles (red lines and squares). Residuals are plotted in the lower panels, showing the difference between the observed and modelled lines, with error bars from the observations included.
Current usage metrics show cumulative count of Article Views (full-text article views including HTML views, PDF and ePub downloads, according to the available data) and Abstracts Views on Vision4Press platform.
Data correspond to usage on the plateform after 2015. The current usage metrics is available 48-96 hours after online publication and is updated daily on week days.
Initial download of the metrics may take a while.