Free Access
Fig. 5
Download original image
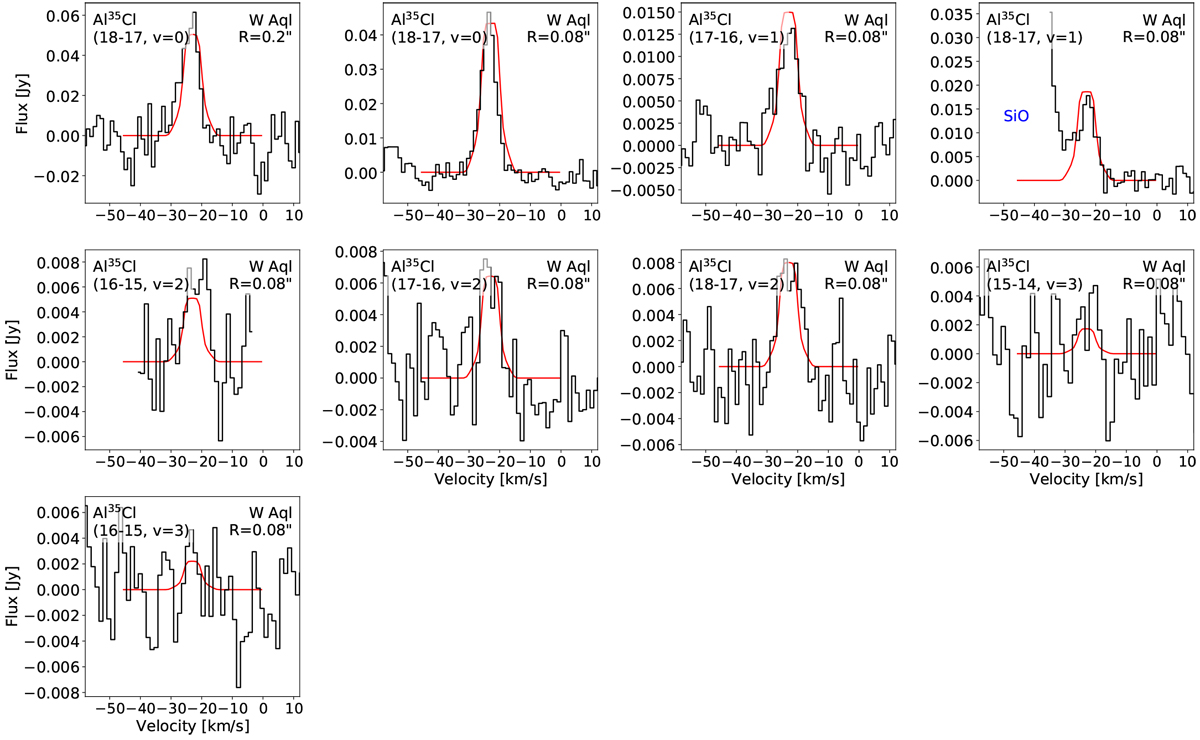
Spectra of Al35Cl observed towards W Aql with ALMA (black histograms), with calculated line profiles (red curves) superposed on the observed profiles. Nearby lines of other molecules are labelled in blue.
Current usage metrics show cumulative count of Article Views (full-text article views including HTML views, PDF and ePub downloads, according to the available data) and Abstracts Views on Vision4Press platform.
Data correspond to usage on the plateform after 2015. The current usage metrics is available 48-96 hours after online publication and is updated daily on week days.
Initial download of the metrics may take a while.