Fig. 3
Download original image
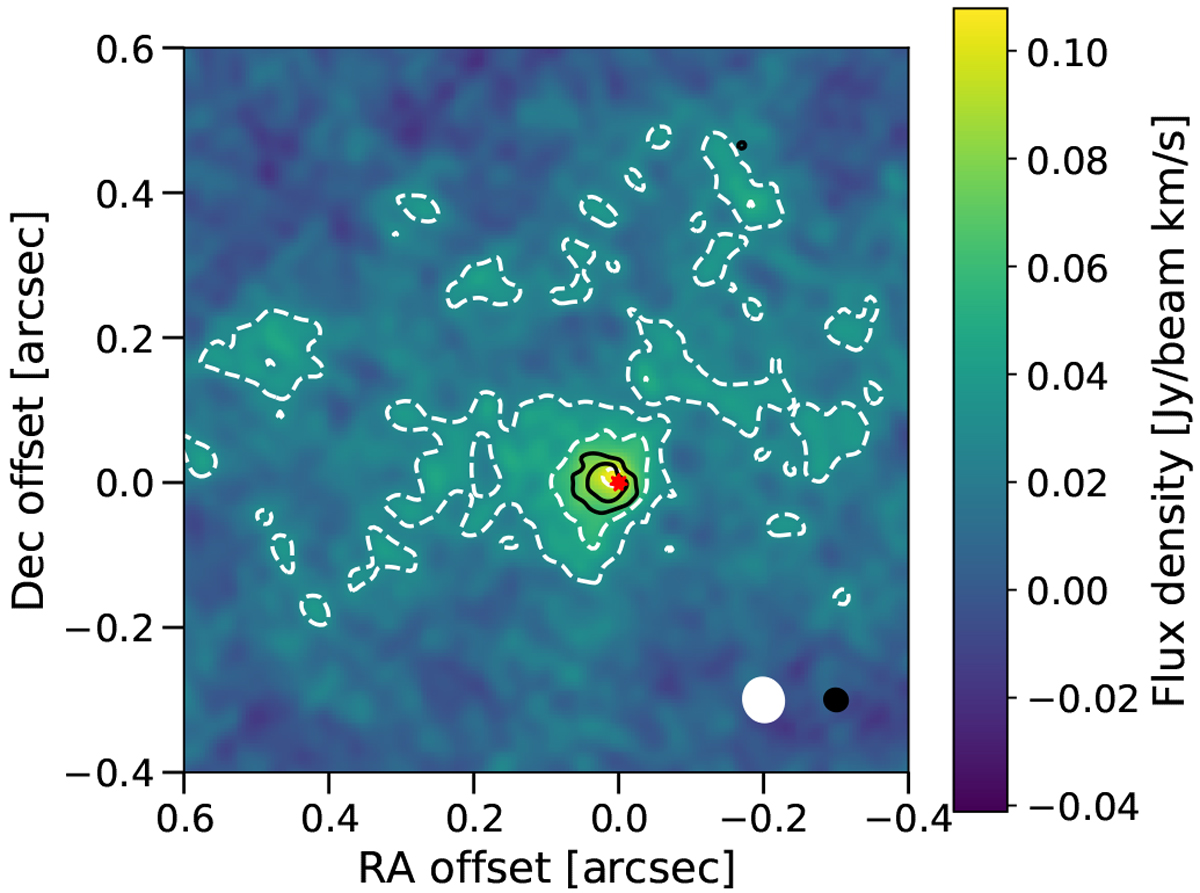
Zeroth moment map of the AlF (7 → 6) line in the ground vibrational state (colours and white dashed contours) plotted with the zeroth moment map of the Al35 Cl (18 → 17) line in the ground vibrational state (black solid contours). The contours are plotted at levels of 3, 5, and 10σ for AlF and 5 and 10σ for Al35 Cl. The red star indicates the position of the continuum peak. The white and black ellipses in the bottom right indicate the synthetic beam sizes for the AlF and Al35 Cl emission, respectively.
Current usage metrics show cumulative count of Article Views (full-text article views including HTML views, PDF and ePub downloads, according to the available data) and Abstracts Views on Vision4Press platform.
Data correspond to usage on the plateform after 2015. The current usage metrics is available 48-96 hours after online publication and is updated daily on week days.
Initial download of the metrics may take a while.