Free Access
Fig. C.3
Download original image
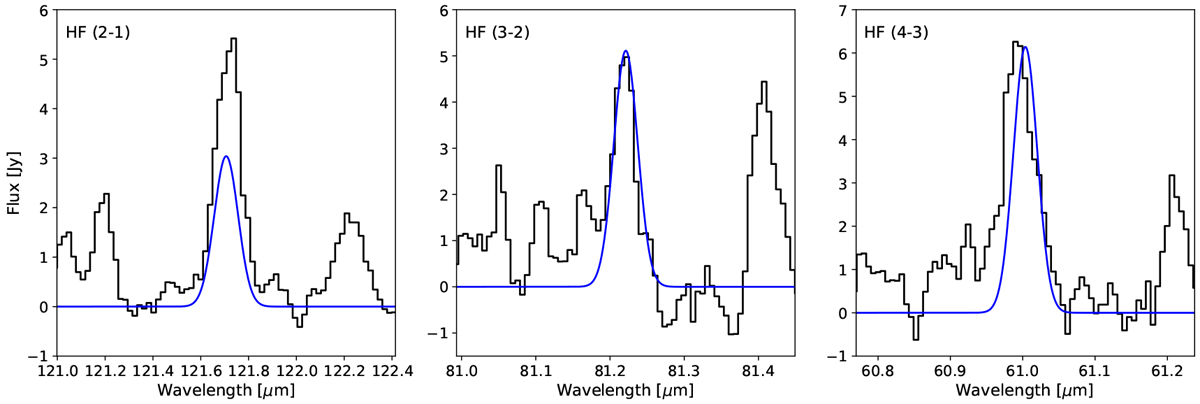
PACS spectra (black histograms) and model results (blue curves) for HF towards χ Cyg. The HF (2 → 1) line is blended with the o-H2O line at 121.721 μm, which is notshown here. See text for details.
Current usage metrics show cumulative count of Article Views (full-text article views including HTML views, PDF and ePub downloads, according to the available data) and Abstracts Views on Vision4Press platform.
Data correspond to usage on the plateform after 2015. The current usage metrics is available 48-96 hours after online publication and is updated daily on week days.
Initial download of the metrics may take a while.