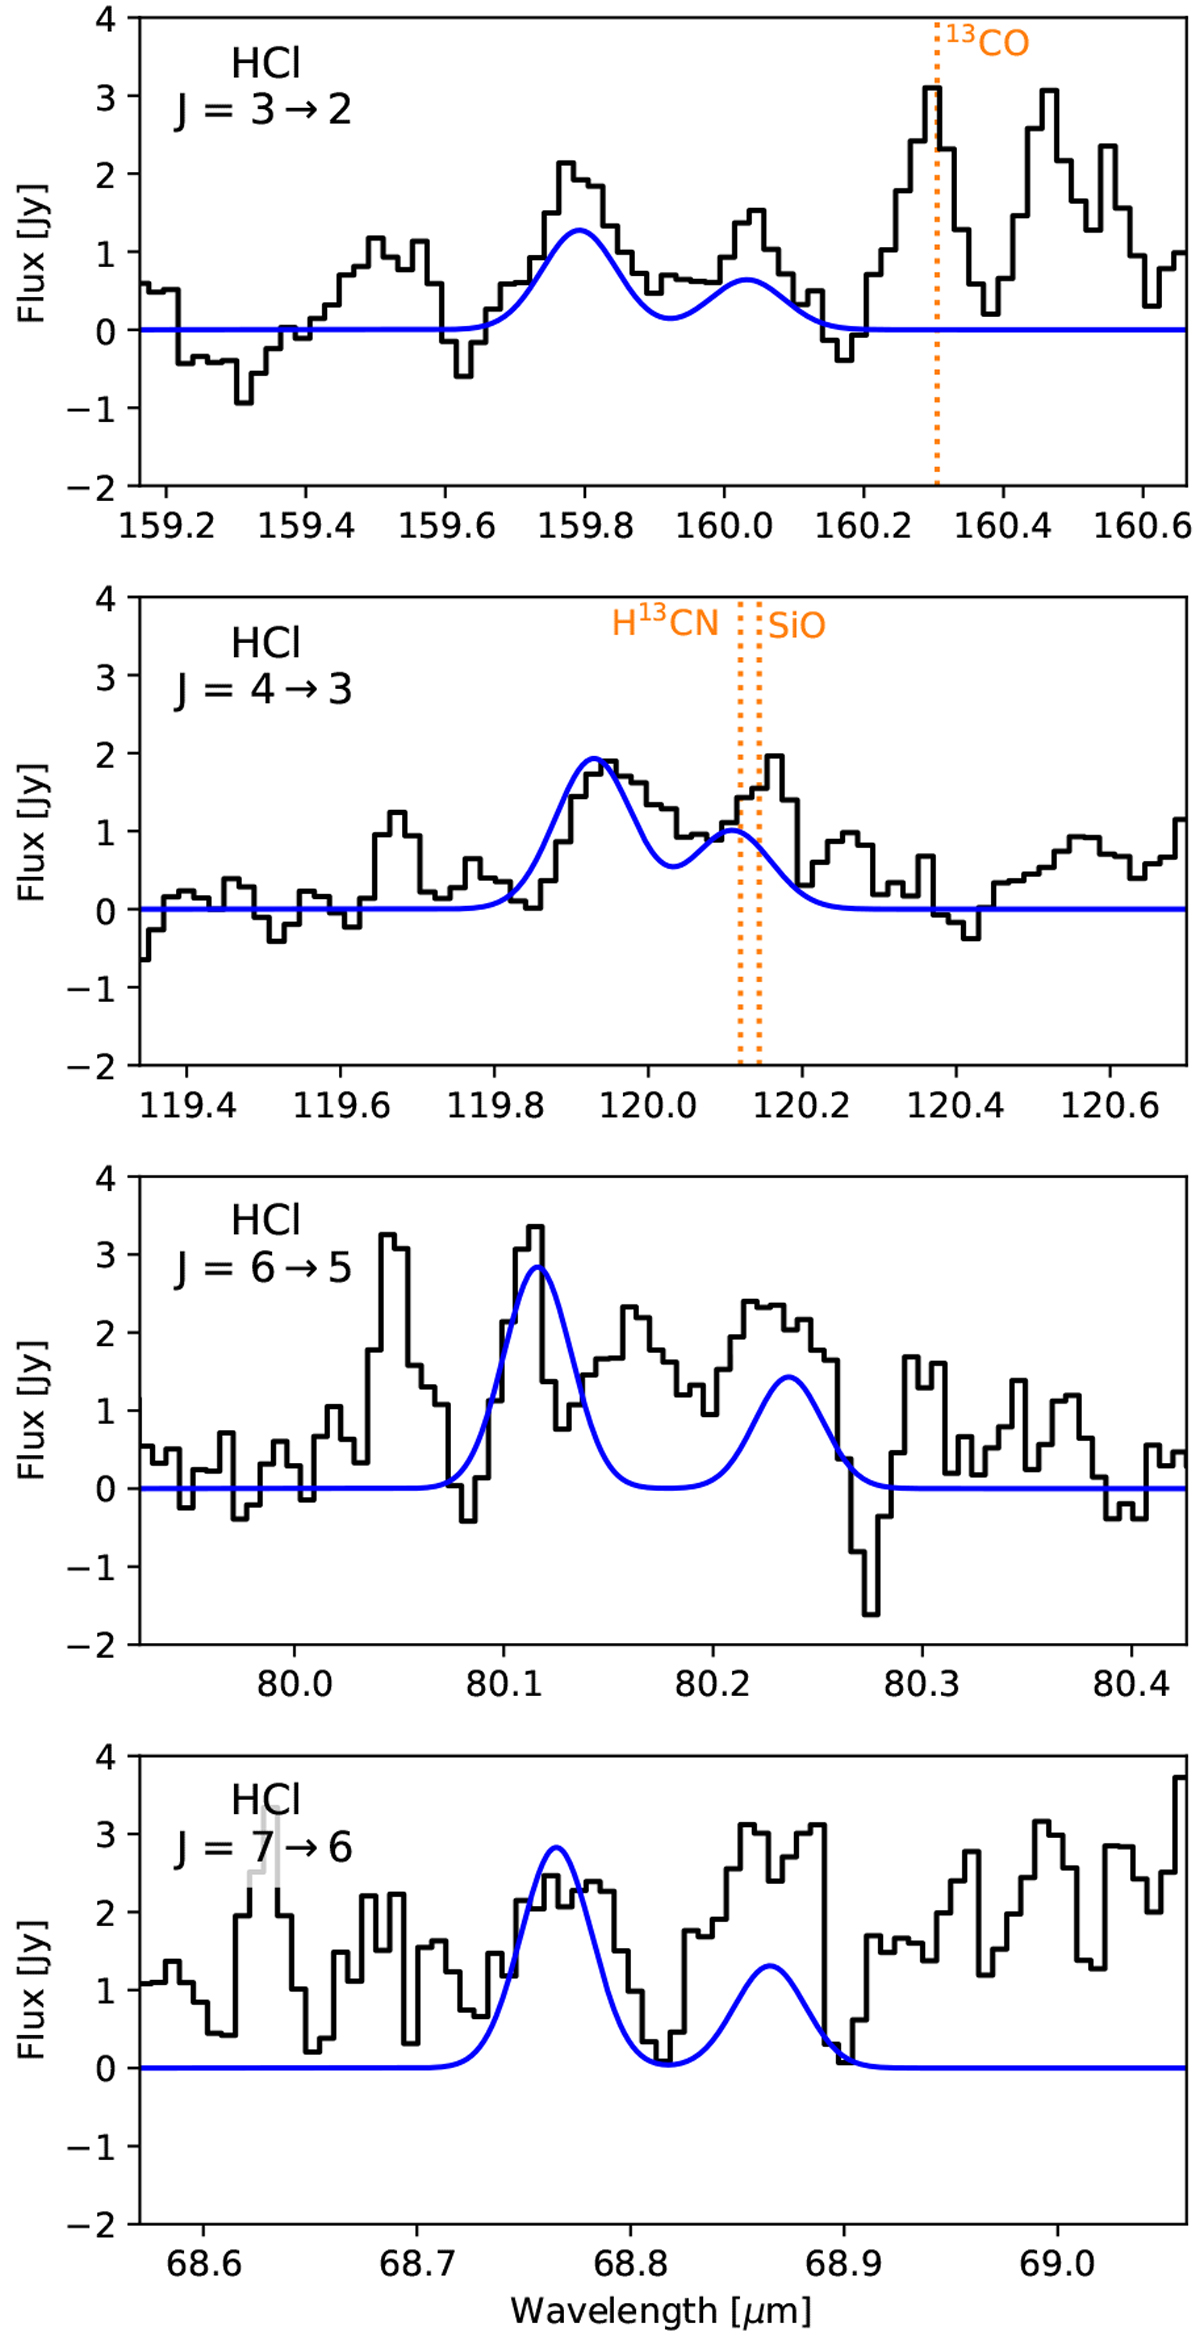
Fig. 10
Download original image
PACS spectra (black histograms) and model results (blue curves) for HCl towards W Aql. For each pair of lines, H35 Cl is shown on the left since it has the shorter wavelength and H37Cl is on the right, with the longer wavelength. Some known nearby and blended lines are indicated in orange (but not all nearby lines have been identified).
Current usage metrics show cumulative count of Article Views (full-text article views including HTML views, PDF and ePub downloads, according to the available data) and Abstracts Views on Vision4Press platform.
Data correspond to usage on the plateform after 2015. The current usage metrics is available 48-96 hours after online publication and is updated daily on week days.
Initial download of the metrics may take a while.