Fig. 1
Download original image
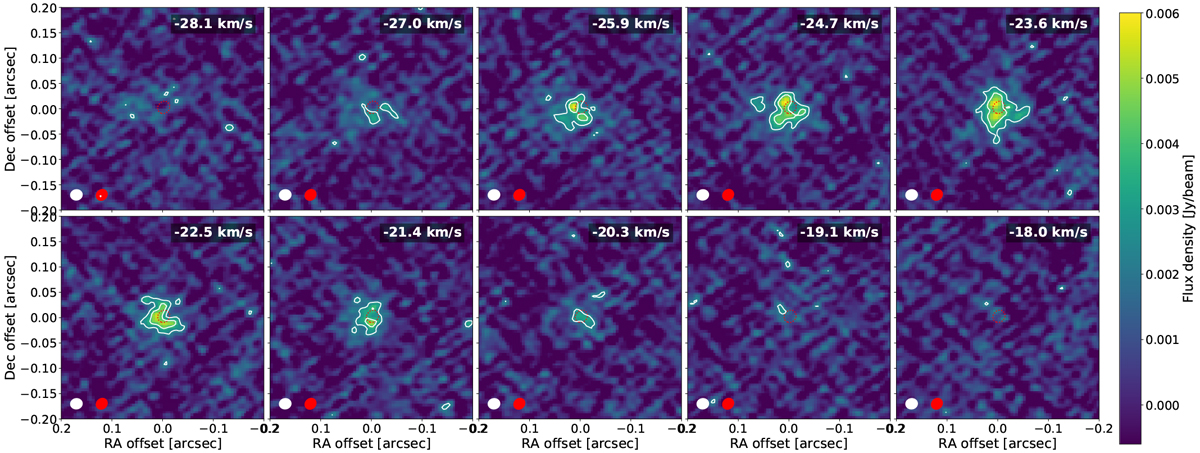
Channel maps of Al35Cl (18 → 17) observed towards W Aql using ALMA in the extended array configuration. The dotted red contours enclose 50% of the total continuum flux. The white contours indicate levels of 3 and 5σ. The ellipses in the bottom left of each panel indicate the synthetic beams for the molecular emission (white) and continuum emission (red).
Current usage metrics show cumulative count of Article Views (full-text article views including HTML views, PDF and ePub downloads, according to the available data) and Abstracts Views on Vision4Press platform.
Data correspond to usage on the plateform after 2015. The current usage metrics is available 48-96 hours after online publication and is updated daily on week days.
Initial download of the metrics may take a while.