Fig. 1
Download original image
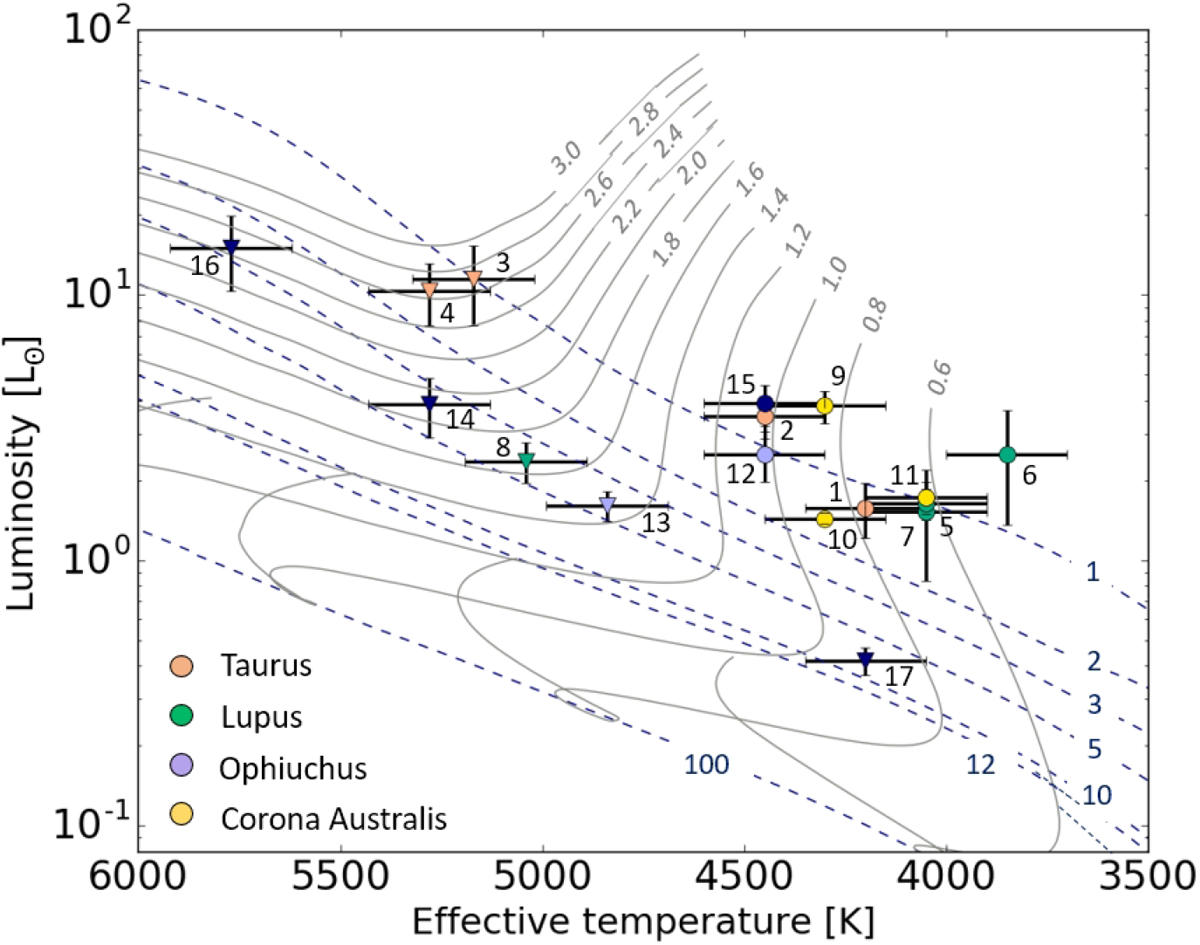
Our T Tauri sample set in the Hertzsprung-Russell diagram. The colors of the symbols denote the star forming regions. Dashed blue lines denote the isochrones for 1, 2, 3, 5, 10, 12, and 100 Ma, and solid gray lines the iso-mass tracks from 0.6 to 3 M⊙. The tracks are PMS PISA tracks (Tognelli et al. 2011) for solar abundances (Z = 0.02 and Y = 0.288), a solar-calibrated mixing length (α = 1.68), and an initial deuterium abundance of 2 × 10⁻⁵. The circles denote the fully convective stars, while the triangles denote the stars with a radiative core and a convective envelope.
Current usage metrics show cumulative count of Article Views (full-text article views including HTML views, PDF and ePub downloads, according to the available data) and Abstracts Views on Vision4Press platform.
Data correspond to usage on the plateform after 2015. The current usage metrics is available 48-96 hours after online publication and is updated daily on week days.
Initial download of the metrics may take a while.