Fig. 9.
Download original image
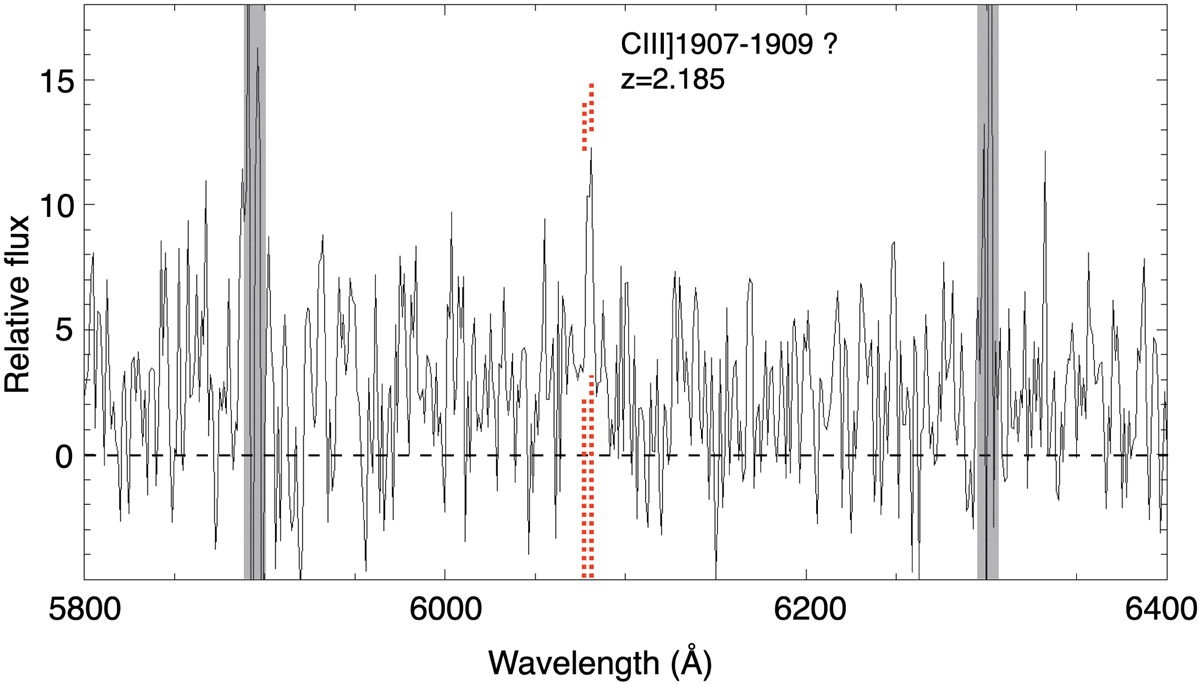
Stack of the spectra (in black) extracted from the MUSE datacube at the multiple image positions of Sys-2. We find evidence for the presence of an emission line at ∼ 6080 Å, which could be interpreted as a CII]1909 doublet (red dotted lines) at z = 2.185, consistent with the redshift estimate obtained with LensTool. The gray vertical bands mark the positions of known sky lines.
Current usage metrics show cumulative count of Article Views (full-text article views including HTML views, PDF and ePub downloads, according to the available data) and Abstracts Views on Vision4Press platform.
Data correspond to usage on the plateform after 2015. The current usage metrics is available 48-96 hours after online publication and is updated daily on week days.
Initial download of the metrics may take a while.