Fig. 8.
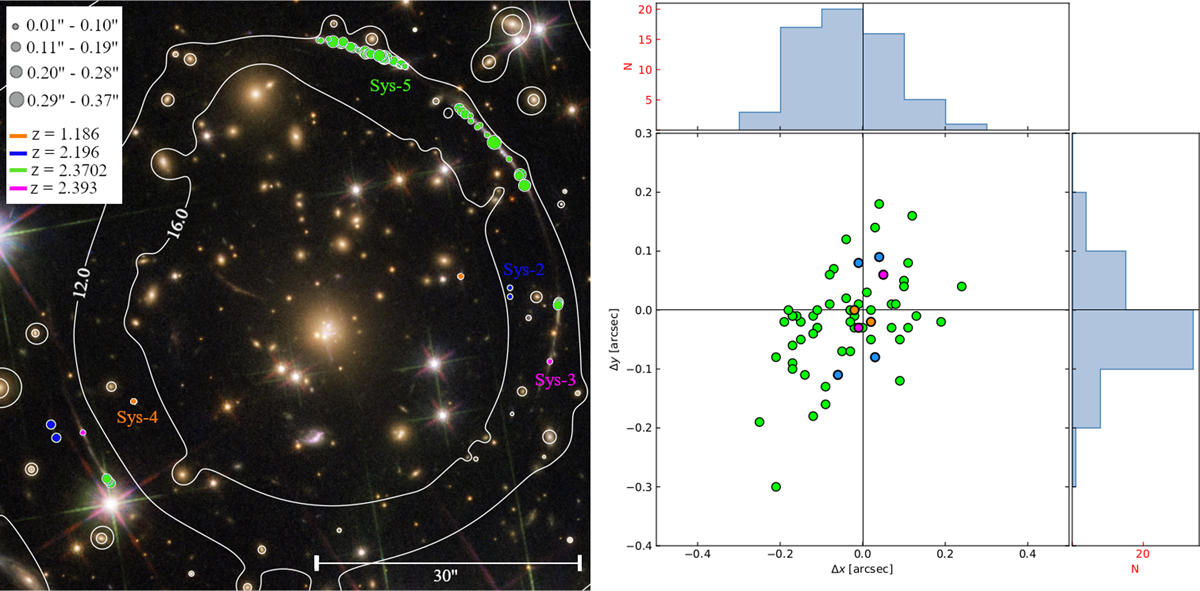
Download original image
Left panel: color composite HST image of PSZ1-G311 with the observed positions of the 62 observed multiple images marked by circles. The size of the circles scales proportionally with the absolute separation (‖Δi‖) between observed and model-predicted positions. The different systems are marked with different colors. Their redshifts are reported in the legend. The white overlaid contours represent the total projected mass–density distribution of our reference model in units of 108 M⊙ kpc−2. Right panel: the larger panel shows the distribution of the separations Δx and Δy in RA and Dec between the observed and the model-predicted image positions. The images are colored according to their system. The upper and right panels show the marginalized distributions of the separations Δx and Δy, respectively.
Current usage metrics show cumulative count of Article Views (full-text article views including HTML views, PDF and ePub downloads, according to the available data) and Abstracts Views on Vision4Press platform.
Data correspond to usage on the plateform after 2015. The current usage metrics is available 48-96 hours after online publication and is updated daily on week days.
Initial download of the metrics may take a while.