Fig. 5.
Download original image
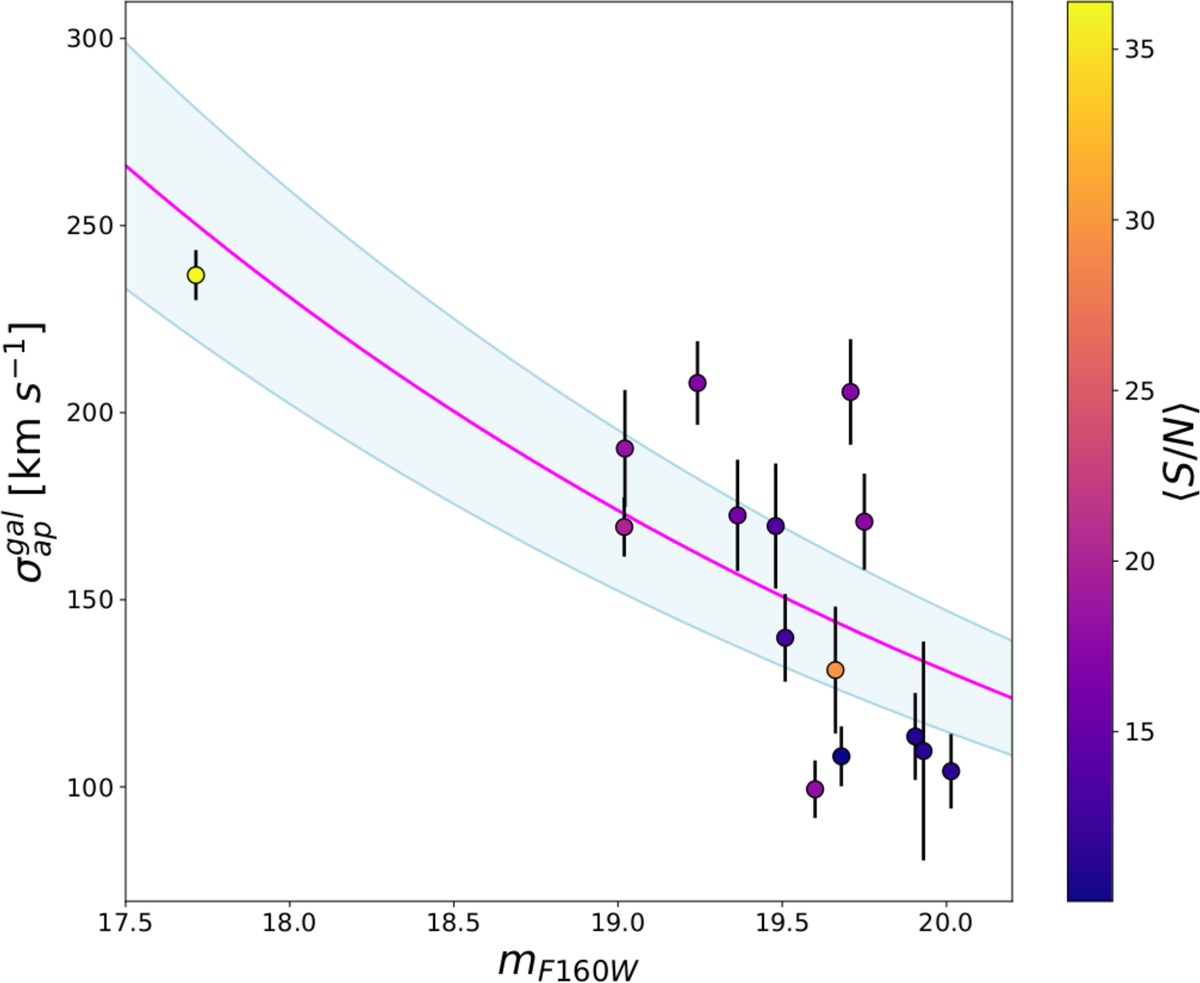
Measured internal stellar velocity dispersion of 15 cluster galaxies as a function of their F160W magnitudes (filled circles). The colors encode the mean signal-to-noise ratio of each measurement, as reported in the color bar to the right. The magenta line is the best-fit σ − mag relation obtained as explained in Sect. 3.1.2, while the light-blue colored band shows the mean scatter around the best fit, Δσap.
Current usage metrics show cumulative count of Article Views (full-text article views including HTML views, PDF and ePub downloads, according to the available data) and Abstracts Views on Vision4Press platform.
Data correspond to usage on the plateform after 2015. The current usage metrics is available 48-96 hours after online publication and is updated daily on week days.
Initial download of the metrics may take a while.