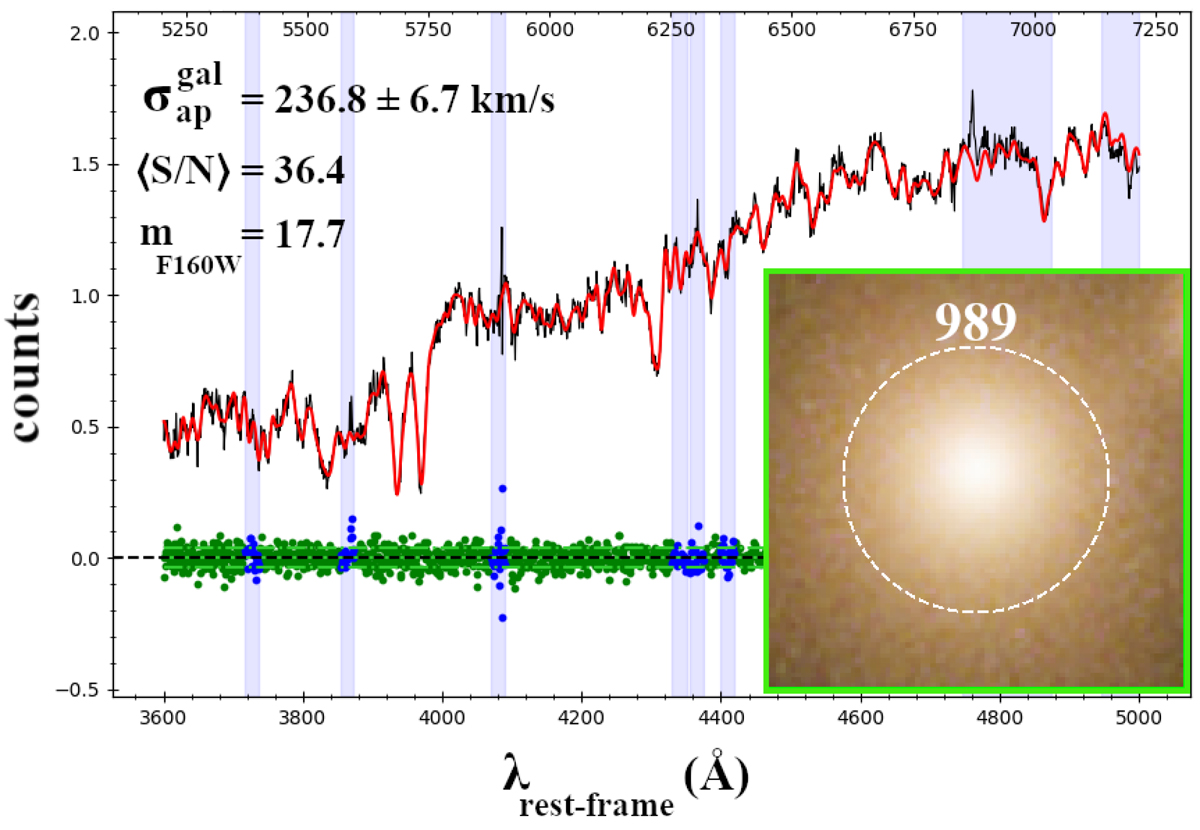
Fig. 4.
Download original image
Ppxf fit of the spectrum of the cluster member Gal-989. The RGB HST image of the galaxy is shown in the cut-out in the bottom-right corner of the figure. The galaxy spectrum, extracted from the dashed white circular aperture shown in the cut-out and the best-fit template are given by the black and red lines, respectively. The resulting velocity dispersion (![]() ) and ⟨S/N⟩ are reported in the upper-left corner, together with the F160W magnitude of the galaxy. The green and blue points show the fit residuals. In performing the fit, we exclude the wavelengths contained in the vertical blue bands (with corresponding residuals in blue points) because of the presence of sky-line residuals.
) and ⟨S/N⟩ are reported in the upper-left corner, together with the F160W magnitude of the galaxy. The green and blue points show the fit residuals. In performing the fit, we exclude the wavelengths contained in the vertical blue bands (with corresponding residuals in blue points) because of the presence of sky-line residuals.
Current usage metrics show cumulative count of Article Views (full-text article views including HTML views, PDF and ePub downloads, according to the available data) and Abstracts Views on Vision4Press platform.
Data correspond to usage on the plateform after 2015. The current usage metrics is available 48-96 hours after online publication and is updated daily on week days.
Initial download of the metrics may take a while.