Fig. 10.
Download original image
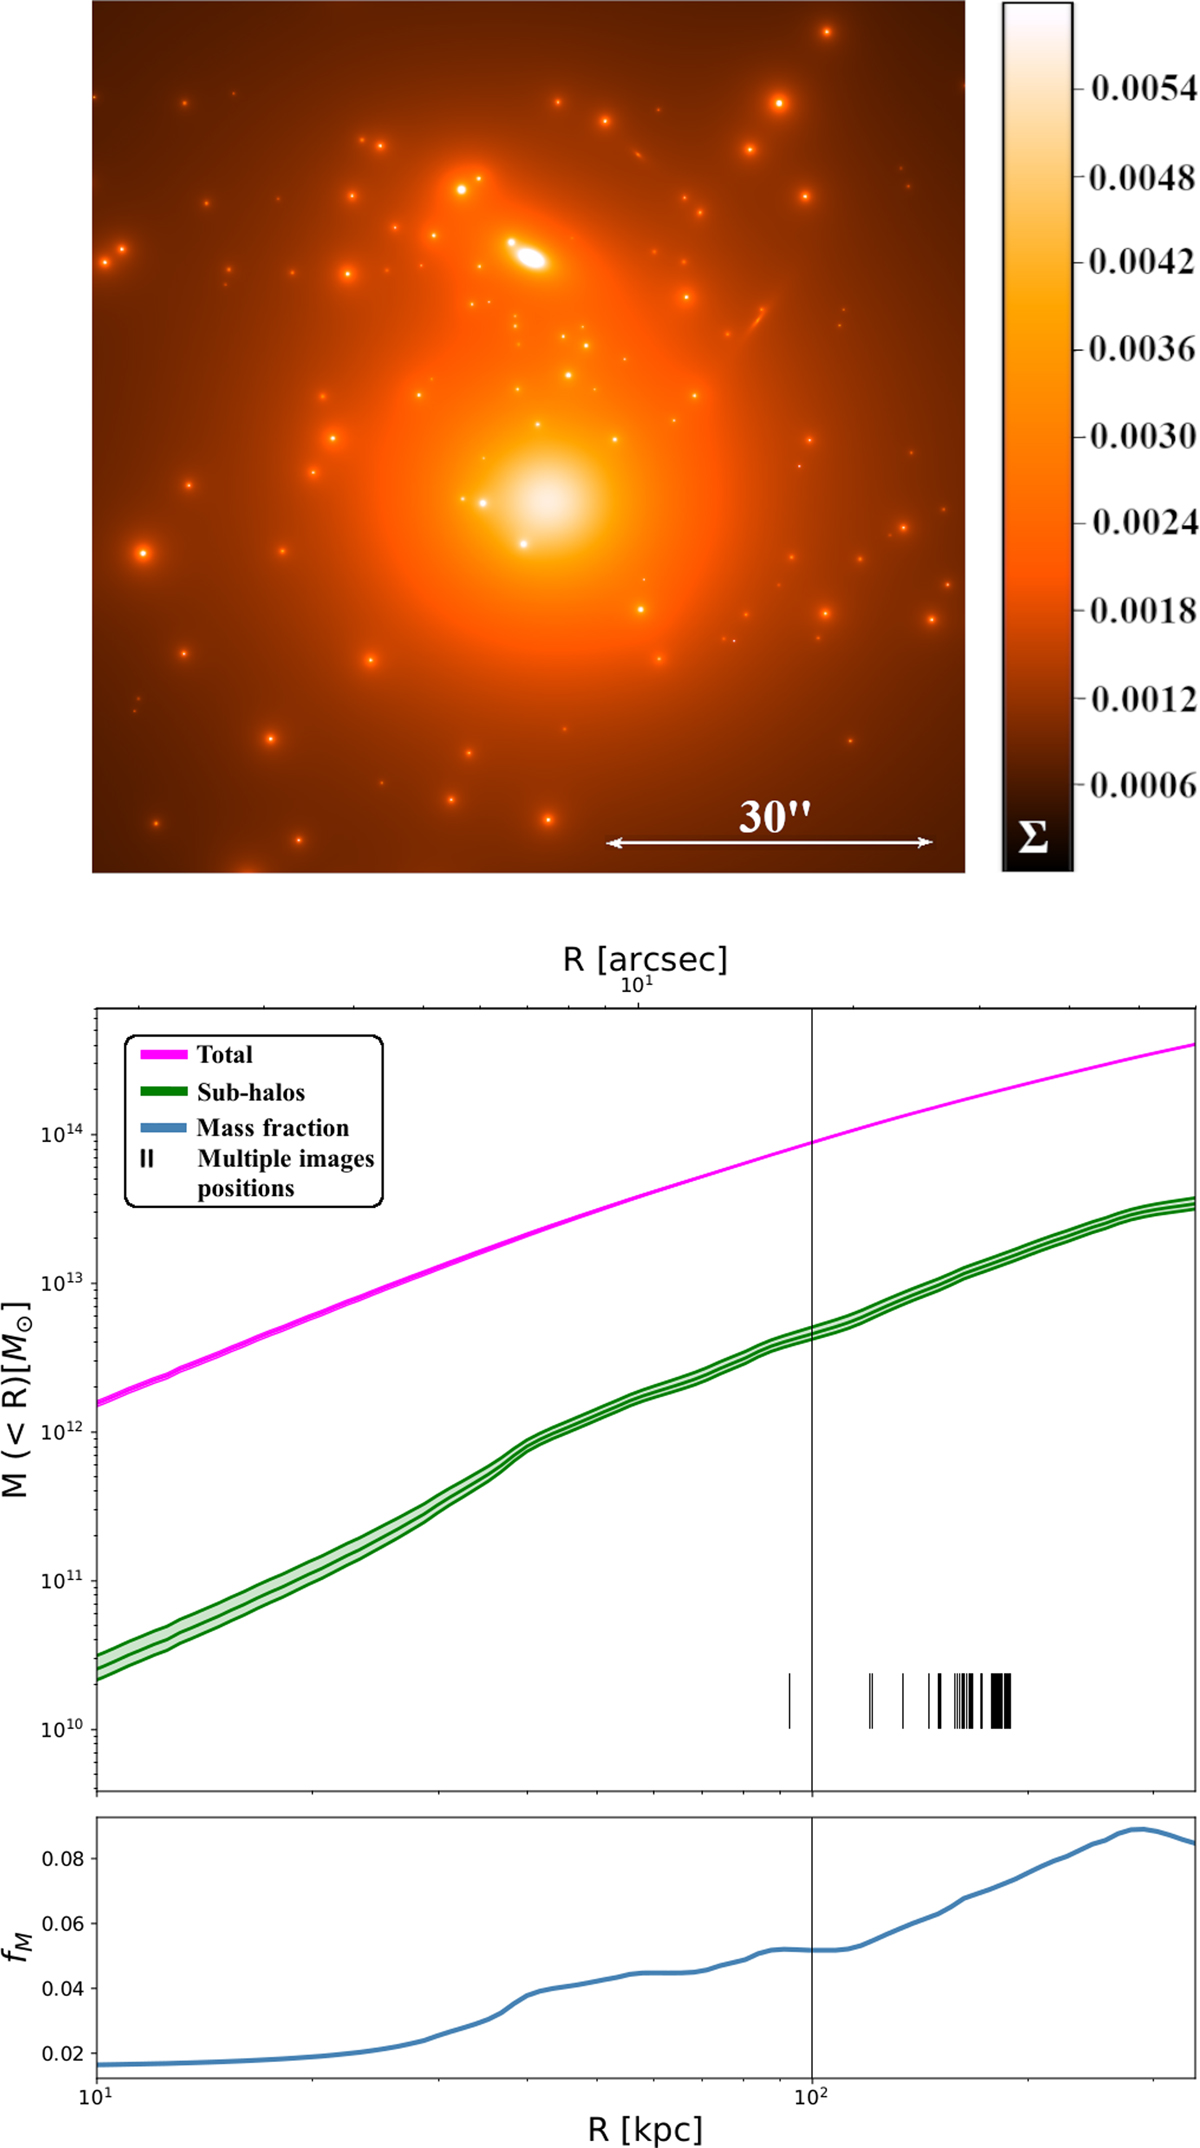
Upper panel: projected mass–density map for the reference model. The color scale is set between 0 and 0.006 in units of 1012 M⊙/kpc2. Bottom panel: projected cumulative mass profiles of PSZ1-G311 as a function of the projected distance from the BCG (R). In magenta we show the median value and the 1-σ confidence levels for the total mass profile. In green we show the median value and the 1-σ confidence levels for the subhalo component mass profile. The positions of the multiple images are marked with vertical black segments. The fractional contribution of the cluster member galaxies mass to the total cumulative mass is shown in blue.
Current usage metrics show cumulative count of Article Views (full-text article views including HTML views, PDF and ePub downloads, according to the available data) and Abstracts Views on Vision4Press platform.
Data correspond to usage on the plateform after 2015. The current usage metrics is available 48-96 hours after online publication and is updated daily on week days.
Initial download of the metrics may take a while.