Fig. 5
Download original image
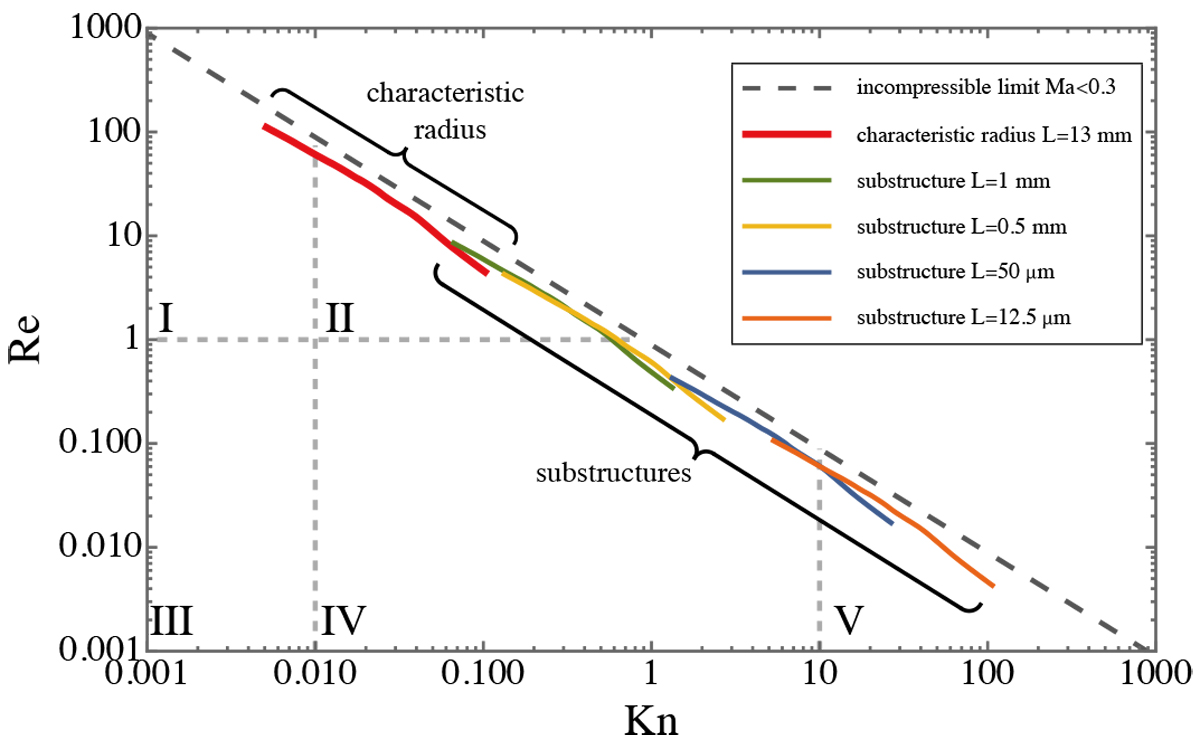
Parameter space tested by the experiments. The roman numerals give the different drag regimes explained in Sect. 2. The red line shows the drag regime of the characteristic radius of the aggregates of ≈ 13 mm (see Table 1). The colored lines show the drag regime of the substructures used, as indicated in the figure legend. Here Kn and Re are calculated with different characteristic sizes L. The aggregates are associated with two different sizes and can therefore be affected by different flow regimes.
Current usage metrics show cumulative count of Article Views (full-text article views including HTML views, PDF and ePub downloads, according to the available data) and Abstracts Views on Vision4Press platform.
Data correspond to usage on the plateform after 2015. The current usage metrics is available 48-96 hours after online publication and is updated daily on week days.
Initial download of the metrics may take a while.