Open Access
Fig. F.1
Download original image
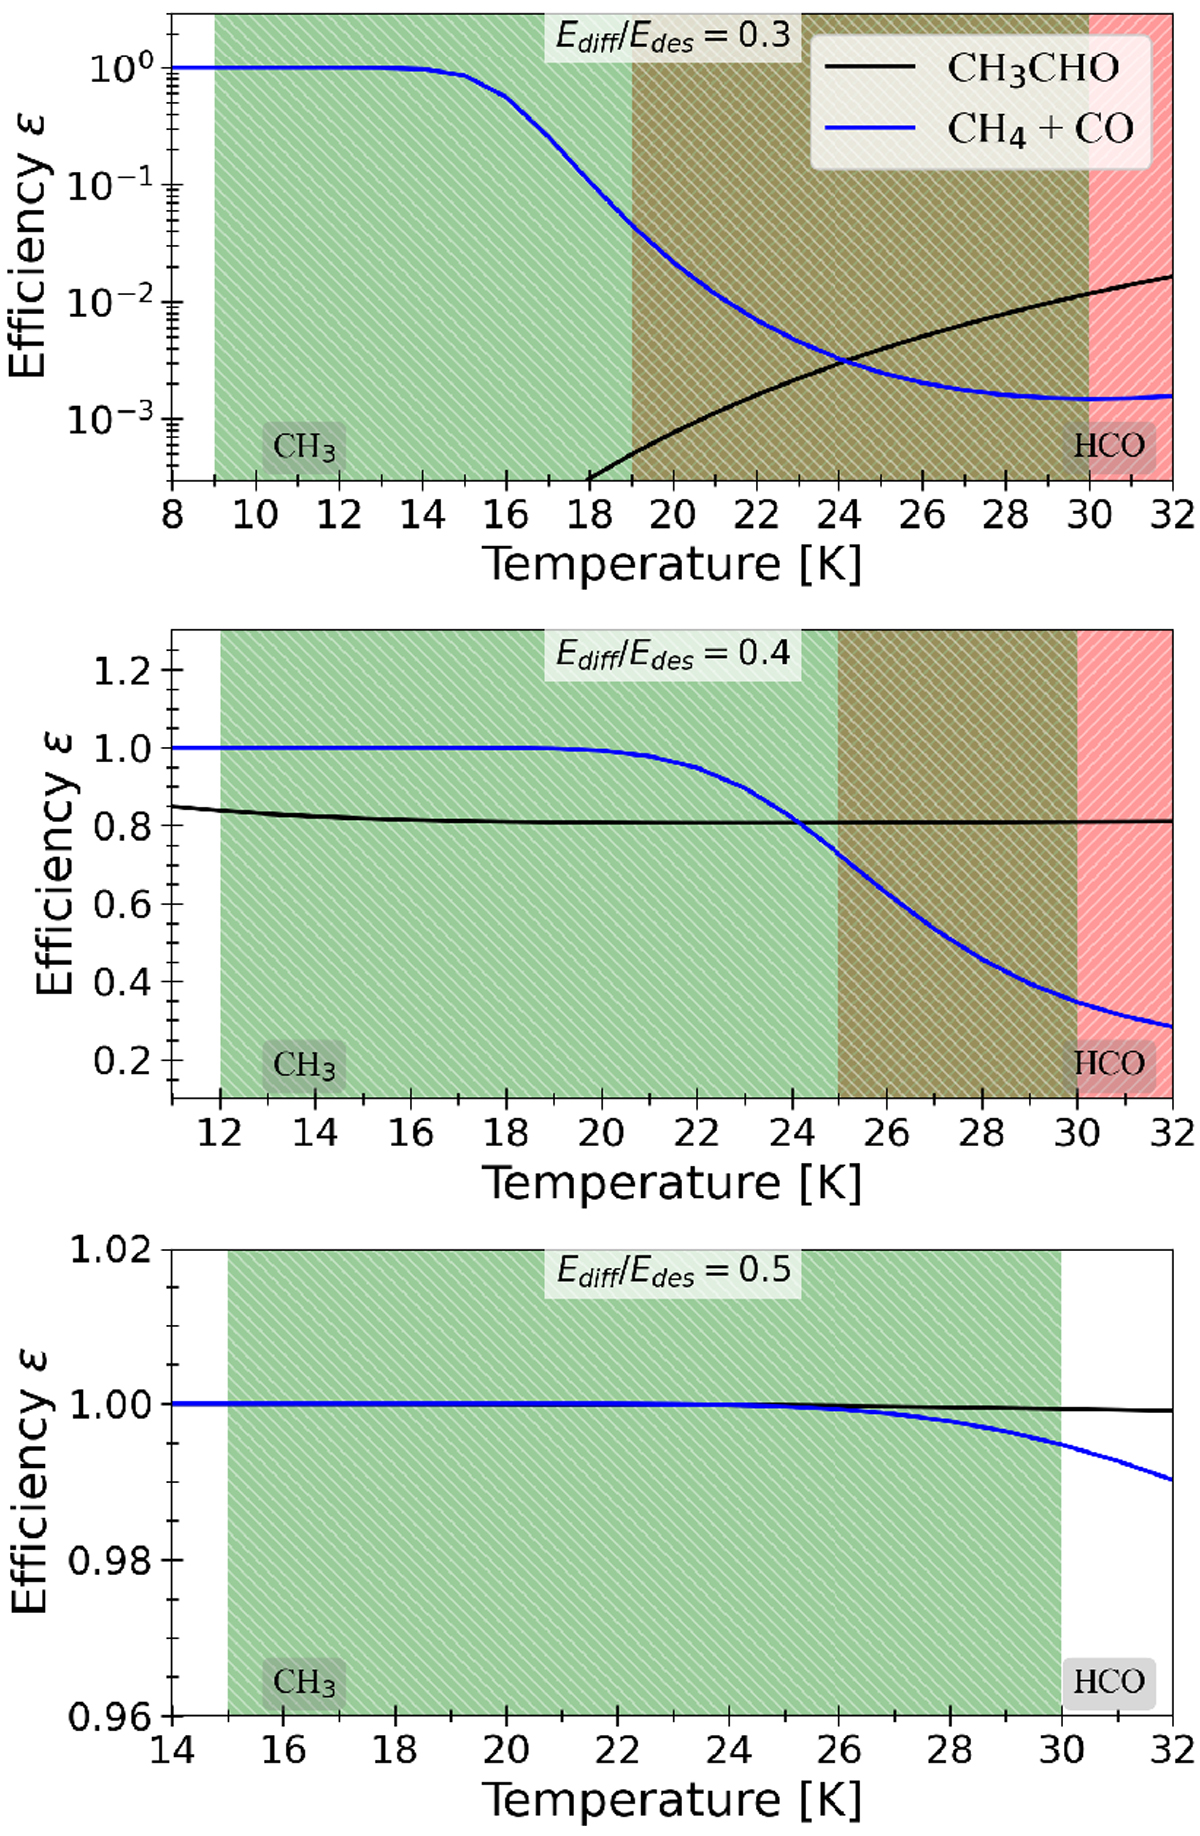
CH3 + HCO reaction efficiencies ε (Eq. 3), assuming diffusion barriers 0.3, 0.4 and 0.5 times those of desorption (panels from top to bottom). The green-colored regions indicate the diffusion and desorption temperatures limits of CH3, while the red ones are the same for HCO.
Current usage metrics show cumulative count of Article Views (full-text article views including HTML views, PDF and ePub downloads, according to the available data) and Abstracts Views on Vision4Press platform.
Data correspond to usage on the plateform after 2015. The current usage metrics is available 48-96 hours after online publication and is updated daily on week days.
Initial download of the metrics may take a while.