Free Access
Fig. 5.
Download original image
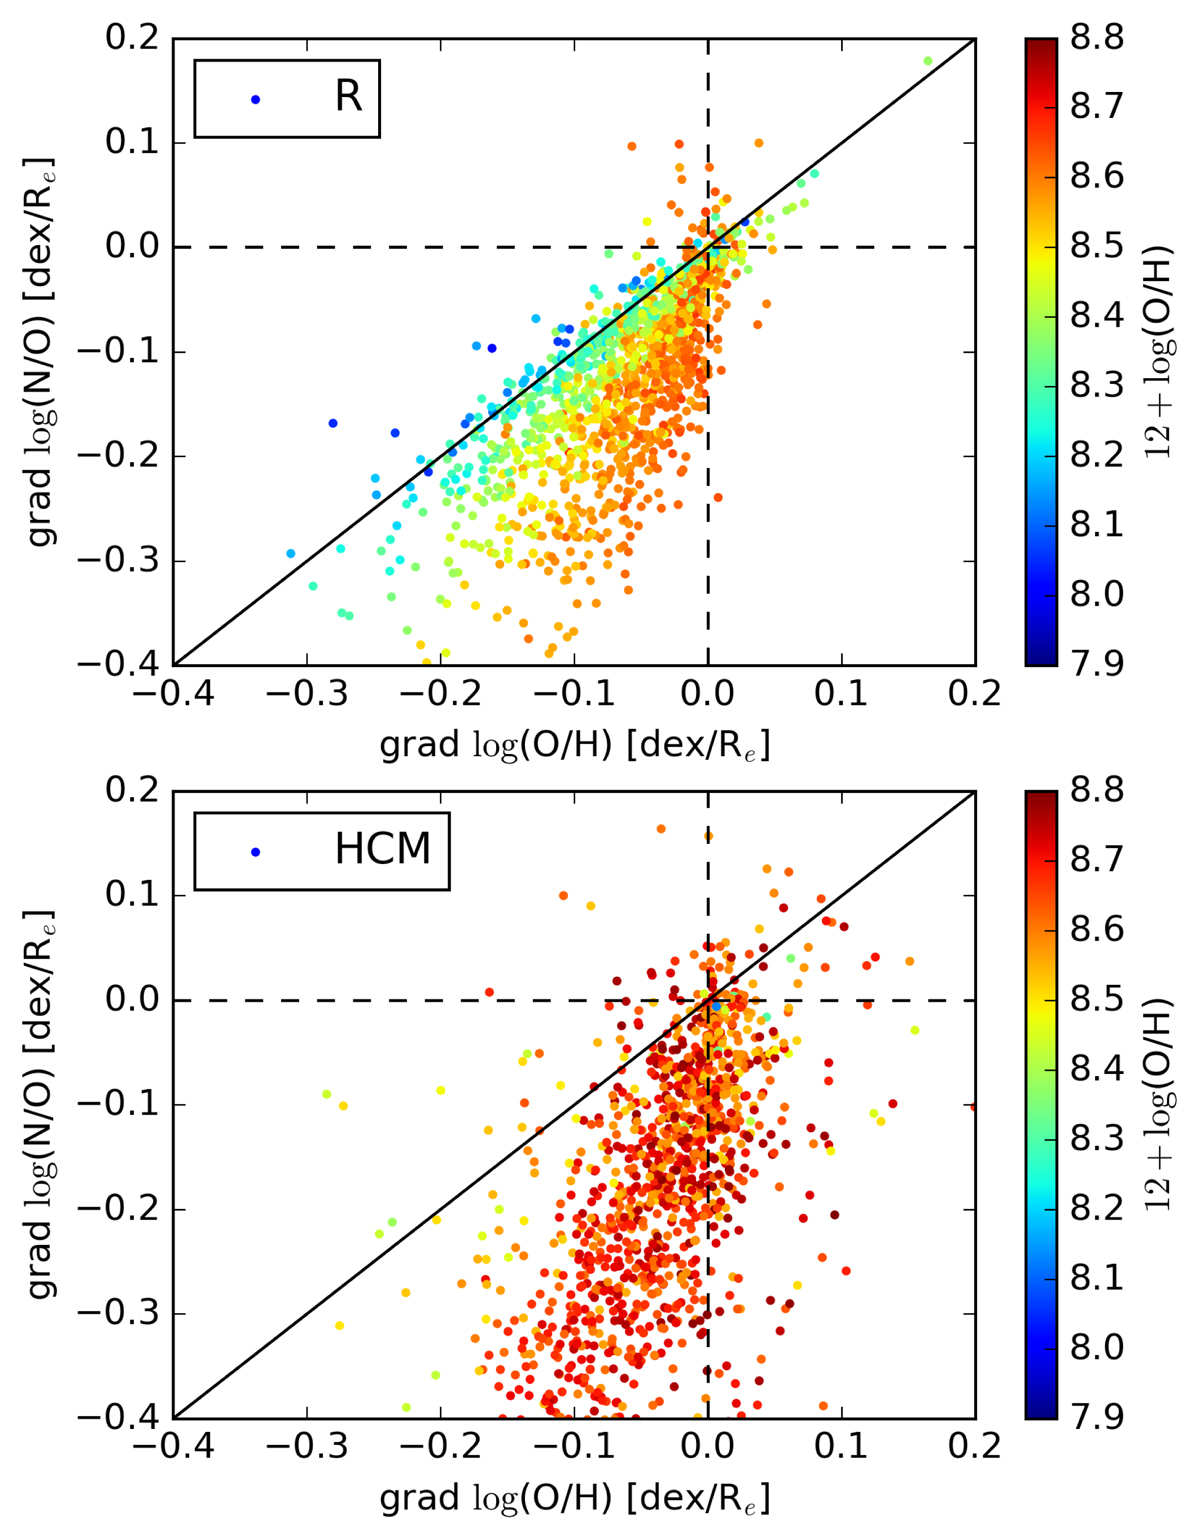
Comparison of oxygen abundance log(O/H) gradient and the log(N/O) ratio gradient for metallicities obtained from the R calibration (top panel) or the HCM method (bottom panel). Colour denotes the oxygen abundance at Re. Black dashed lines are zero gradients. Solid black line is a one-to-one correspondence for reference.
Current usage metrics show cumulative count of Article Views (full-text article views including HTML views, PDF and ePub downloads, according to the available data) and Abstracts Views on Vision4Press platform.
Data correspond to usage on the plateform after 2015. The current usage metrics is available 48-96 hours after online publication and is updated daily on week days.
Initial download of the metrics may take a while.