Free Access
Fig. 9
Download original image
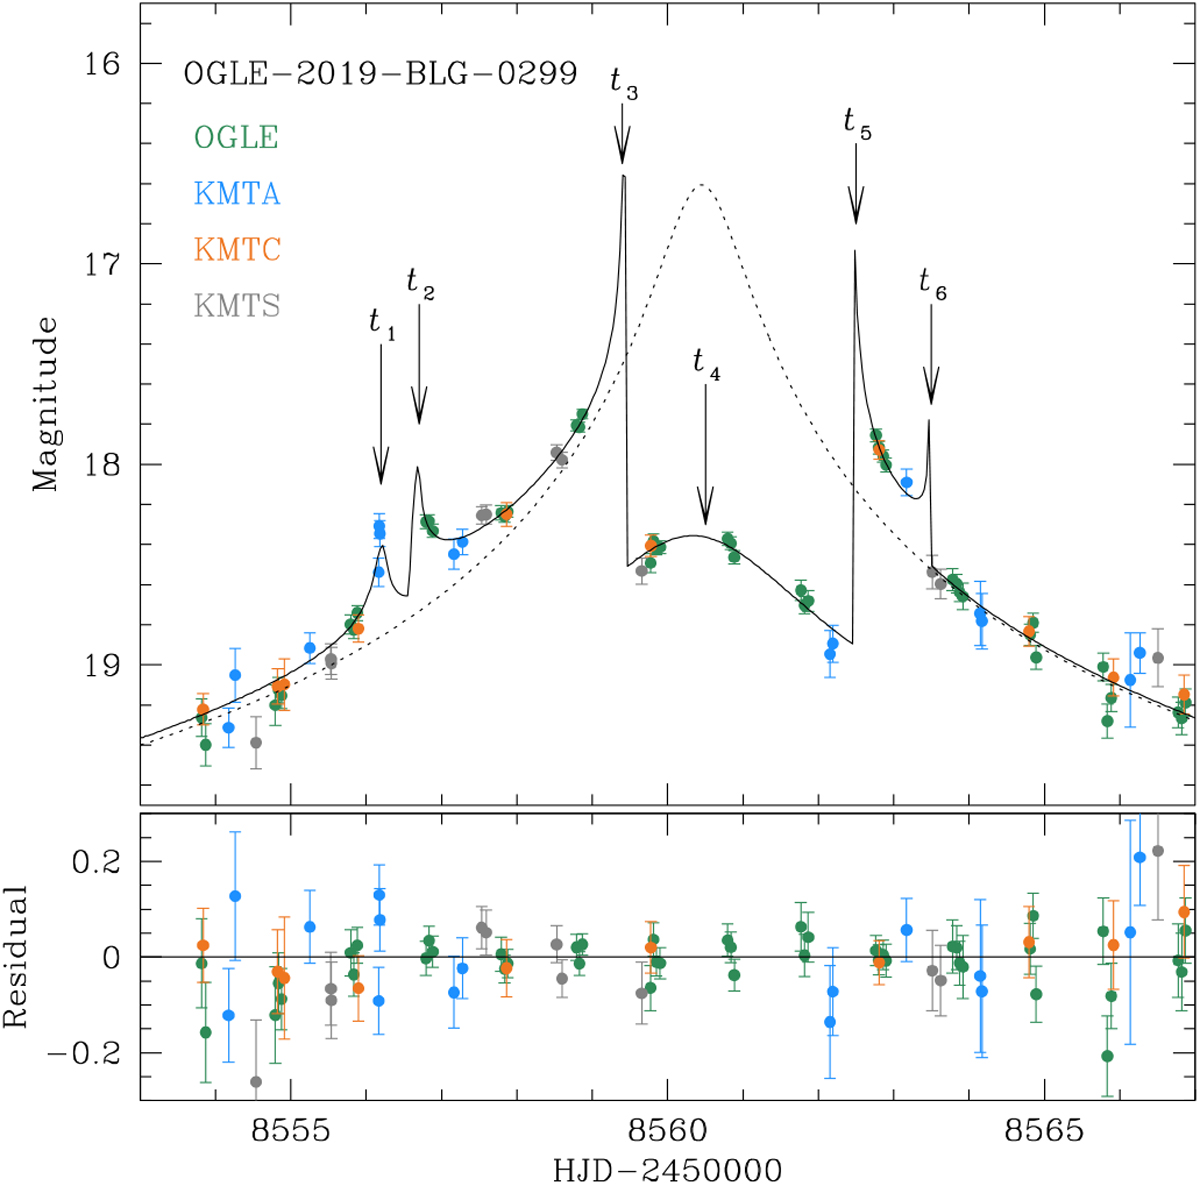
Enlarged view around the anomaly region of the OGLE-2019-BLG-0299 light curve. The positions marked by arrows and labeled as t1, t2, t3, t4, t5, and t6 represent the epochs of major anomaly features.
Current usage metrics show cumulative count of Article Views (full-text article views including HTML views, PDF and ePub downloads, according to the available data) and Abstracts Views on Vision4Press platform.
Data correspond to usage on the plateform after 2015. The current usage metrics is available 48-96 hours after online publication and is updated daily on week days.
Initial download of the metrics may take a while.