Fig. 7
Download original image
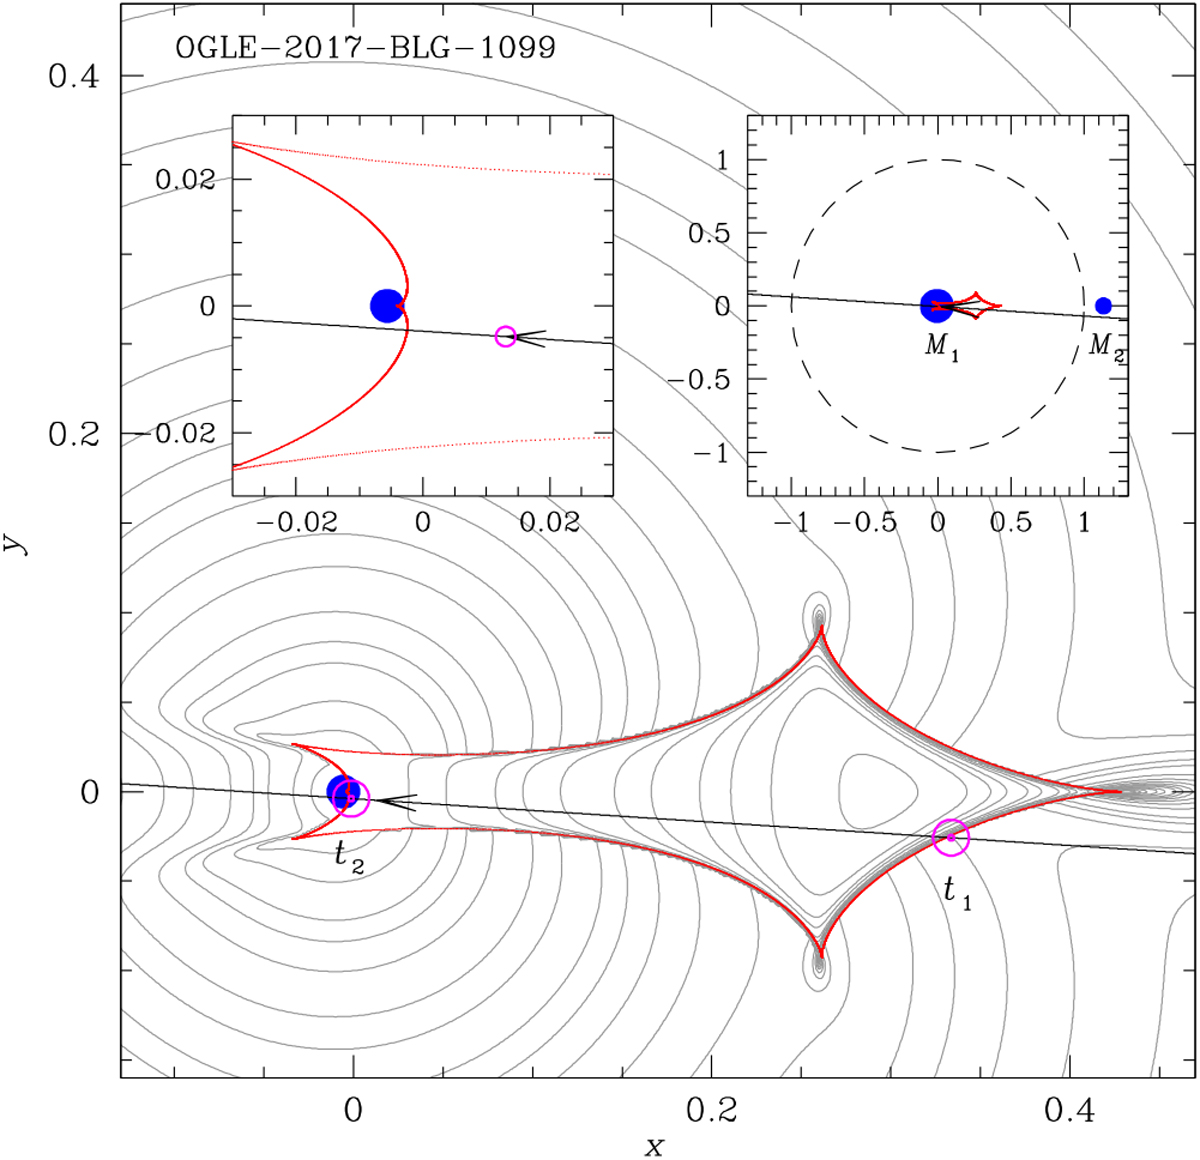
Lens system configuration of OGLE-2017-BLG-1099. Notations are the same as those in Fig. 4, except that an additional inset (left) is presented to show a zoomed-in view of the central region. The source positions corresponding to t1 and t2 designated in Fig. 5 are marked by the empty magenta dots. The size of the dot in the main panel is arbitrary, but the dot in the left inset is scaled to the source size.
Current usage metrics show cumulative count of Article Views (full-text article views including HTML views, PDF and ePub downloads, according to the available data) and Abstracts Views on Vision4Press platform.
Data correspond to usage on the plateform after 2015. The current usage metrics is available 48-96 hours after online publication and is updated daily on week days.
Initial download of the metrics may take a while.