Fig. 4
Download original image
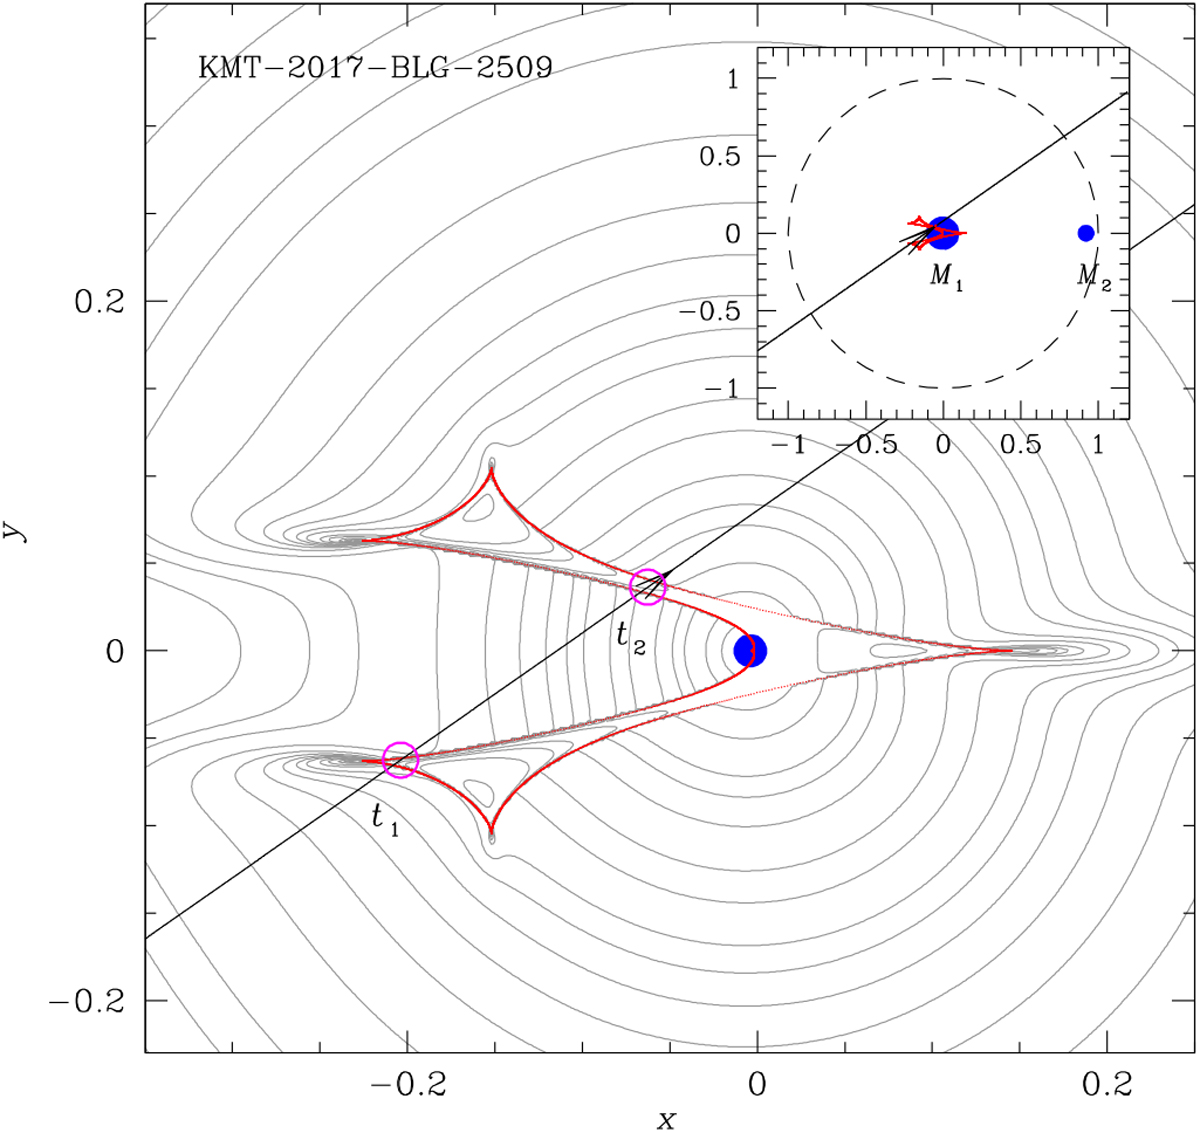
Lens system configuration of KMT-2017-BLG-2509. The inset shows the whole view of the lens system, and the main panel shows the enlarged view around the caustic. The red closed figure is the caustic, the line with an arrow represents the source motion, the two filled blue dots indicate the positions of the lens components, and the dashed circle is the Einstein ring. The gray curves around the caustic represent equi-magnification contours. The empty magenta dots on the source trajectory represent the source positions at t1 and t2, marked in Fig. 2. The size of the dot is not scaled to the source size.
Current usage metrics show cumulative count of Article Views (full-text article views including HTML views, PDF and ePub downloads, according to the available data) and Abstracts Views on Vision4Press platform.
Data correspond to usage on the plateform after 2015. The current usage metrics is available 48-96 hours after online publication and is updated daily on week days.
Initial download of the metrics may take a while.