Free Access
Fig. 2
Download original image
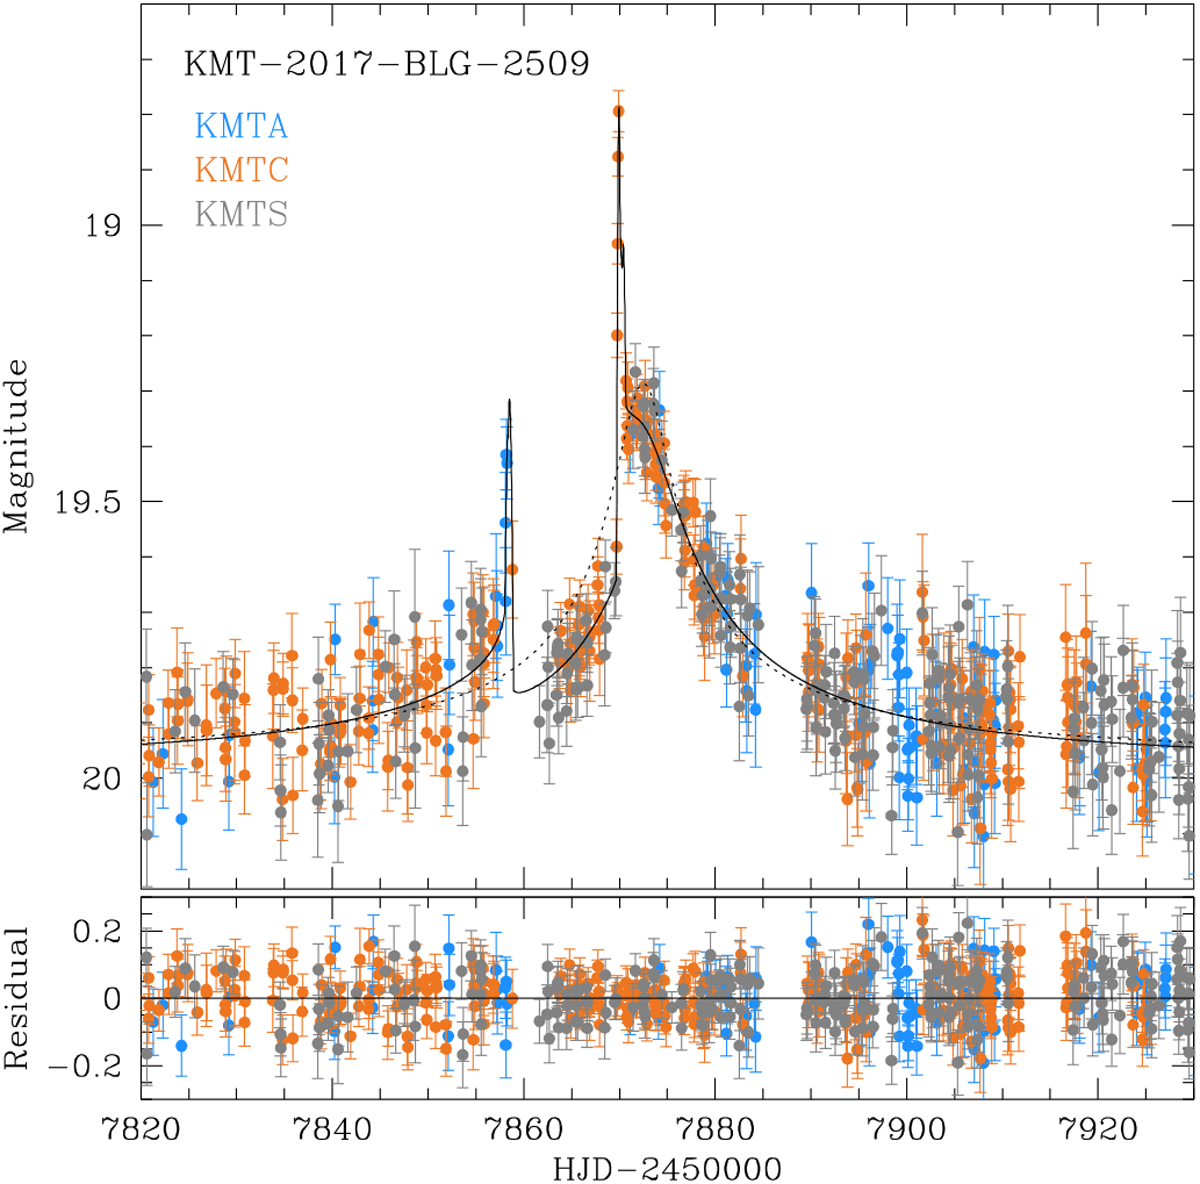
Light curve of KMT-2017-BLG-2509. The dotted and solid curves plotted over the data points represent the 1L1S and 2L1S models, respectively. The residual of the 2L1S model is shown in the lower panel. The colors of the telescopes in the legend are set to match those of the data points.
Current usage metrics show cumulative count of Article Views (full-text article views including HTML views, PDF and ePub downloads, according to the available data) and Abstracts Views on Vision4Press platform.
Data correspond to usage on the plateform after 2015. The current usage metrics is available 48-96 hours after online publication and is updated daily on week days.
Initial download of the metrics may take a while.