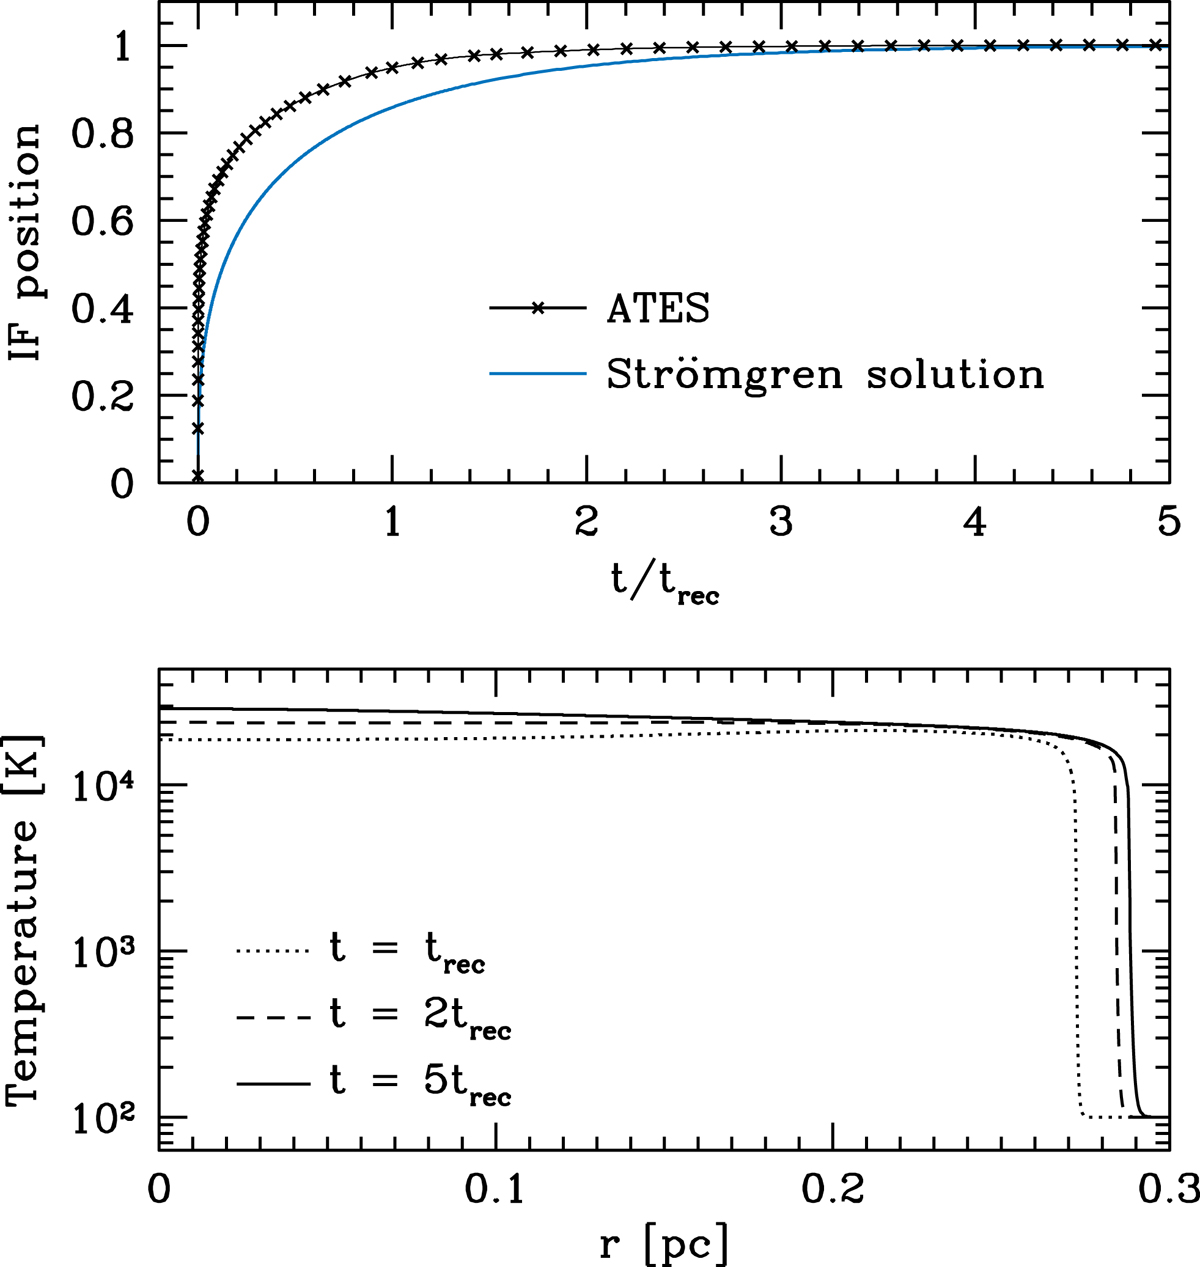
Fig. 3.
Download original image
Results from the simulation of the temporal evolution of a rarefied ionization front. Top panel: temporal evolution of the ionization front. The evolution of the ionization front position (in units of RS; see Eq. (30)) computed by ATES is represented by the black crosses, and compared to the analytical solution (see Eq. (29)), shown by the solid blue line. Bottom panel: the ionization front temperature profiles are shown at different times, as a function of the distance from the central star.
Current usage metrics show cumulative count of Article Views (full-text article views including HTML views, PDF and ePub downloads, according to the available data) and Abstracts Views on Vision4Press platform.
Data correspond to usage on the plateform after 2015. The current usage metrics is available 48-96 hours after online publication and is updated daily on week days.
Initial download of the metrics may take a while.