Free Access
Fig. 8
Download original image
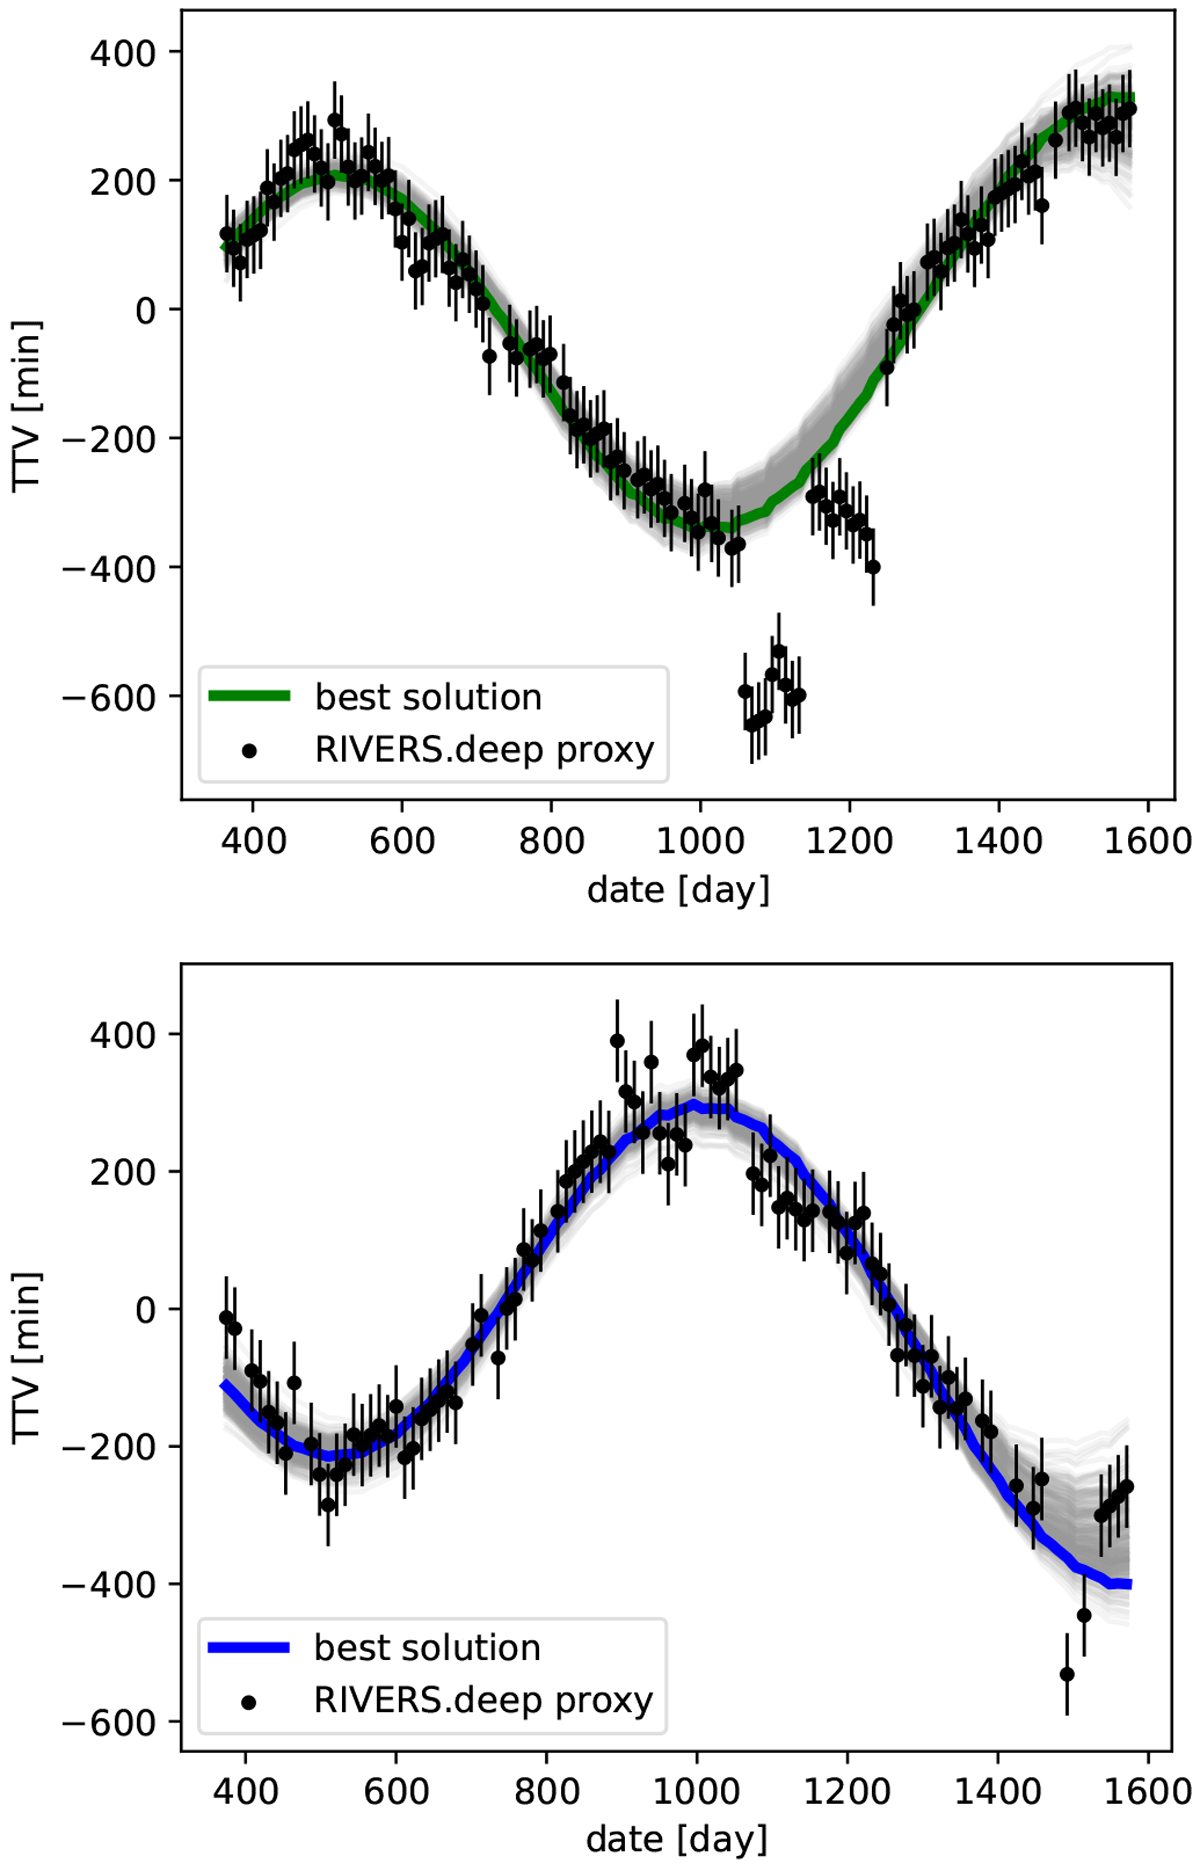
TTVs for Kepler-1705b (top) and Kepler-1705c (bottom). The black error bars represent the TTVs proxy coming from the RIVERS.deep method. The dates are in [BJD-2 454 833.0]. In grey are 300 samples resulting from the fit of the light curve. The solid coloured curves correspond to the best fit.
Current usage metrics show cumulative count of Article Views (full-text article views including HTML views, PDF and ePub downloads, according to the available data) and Abstracts Views on Vision4Press platform.
Data correspond to usage on the plateform after 2015. The current usage metrics is available 48-96 hours after online publication and is updated daily on week days.
Initial download of the metrics may take a while.