Fig. 2
Download original image
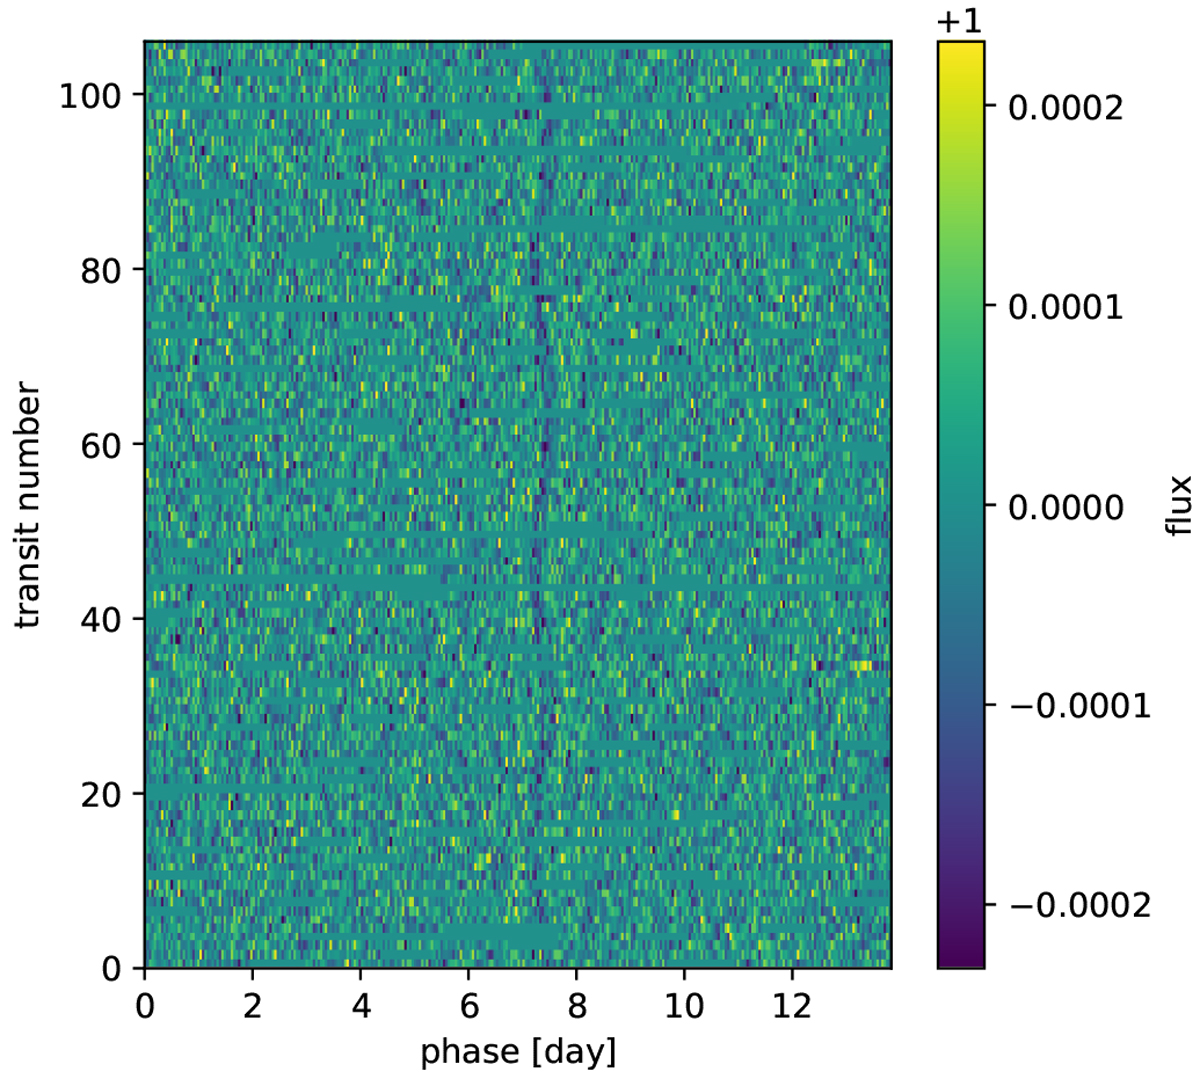
River diagram of Kepler-36 at the period 13.848d: the bottom row displays the first 13.848 days of data for Kepler-36, with the colour code representing the normalised flux. Each subsequent row displays a new set of 13.848 days of data. The flux has been clipped at 3σ for visibility, and missing data have been replaced by a flux of 1.
Current usage metrics show cumulative count of Article Views (full-text article views including HTML views, PDF and ePub downloads, according to the available data) and Abstracts Views on Vision4Press platform.
Data correspond to usage on the plateform after 2015. The current usage metrics is available 48-96 hours after online publication and is updated daily on week days.
Initial download of the metrics may take a while.