Fig. 12
Download original image
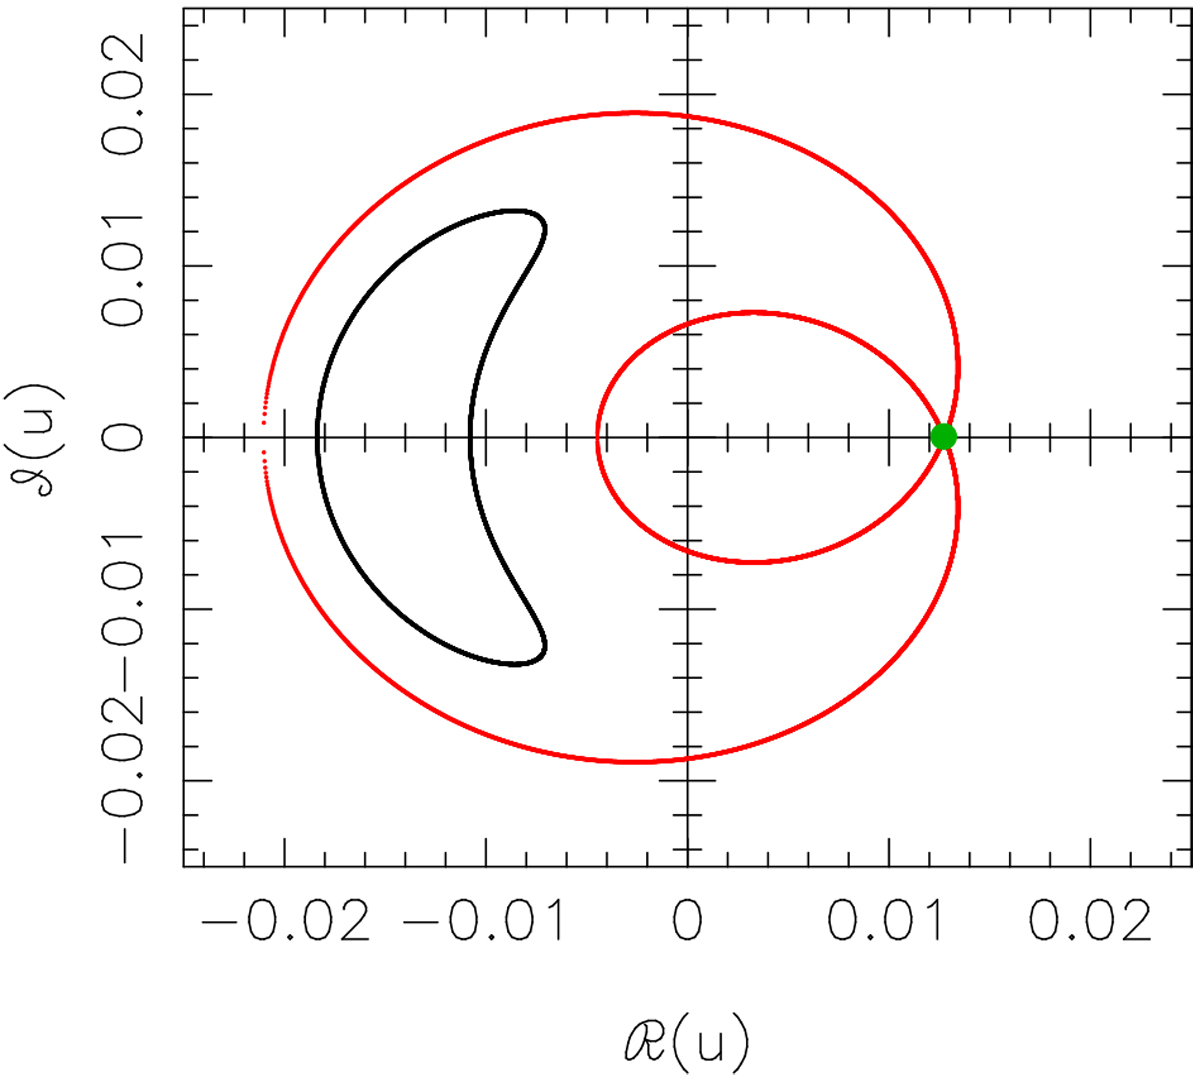
A phase-space plot showing the variation of the real and imaginary parts of the transformation variable u (black curve: see Eq. (7) for its definition in terms of the eccentricities and resonance angles). The best-fit solution has been used for the initial conditions of the black curve. As u is constant over its theoretical distribution (yellow points in the second panel of Fig. 11), and varies little over its MCMC distribution (green points), the black curve represents in practice all points of the posterior. The phase space in which a system resides is resonant when there exists a solution containing a hyperbolic fixed point (green point in this figure) which has the same angular momentum as the system but a different energy. The separatrix (red curve) separates librating solutions from circulating solutions. The Kepler-1705 system is formally resonant because the phase space is resonant; it is in the librating state because it resides inside the separatrix. Being in the librating state allows determination of the planetary masses, independent of the eccentricities and the resonant state of the phase space (see text for discussion). We note that these curves are not surface-of-section projections but are true one-dimensional curves.
Current usage metrics show cumulative count of Article Views (full-text article views including HTML views, PDF and ePub downloads, according to the available data) and Abstracts Views on Vision4Press platform.
Data correspond to usage on the plateform after 2015. The current usage metrics is available 48-96 hours after online publication and is updated daily on week days.
Initial download of the metrics may take a while.