Fig. 11
Download original image
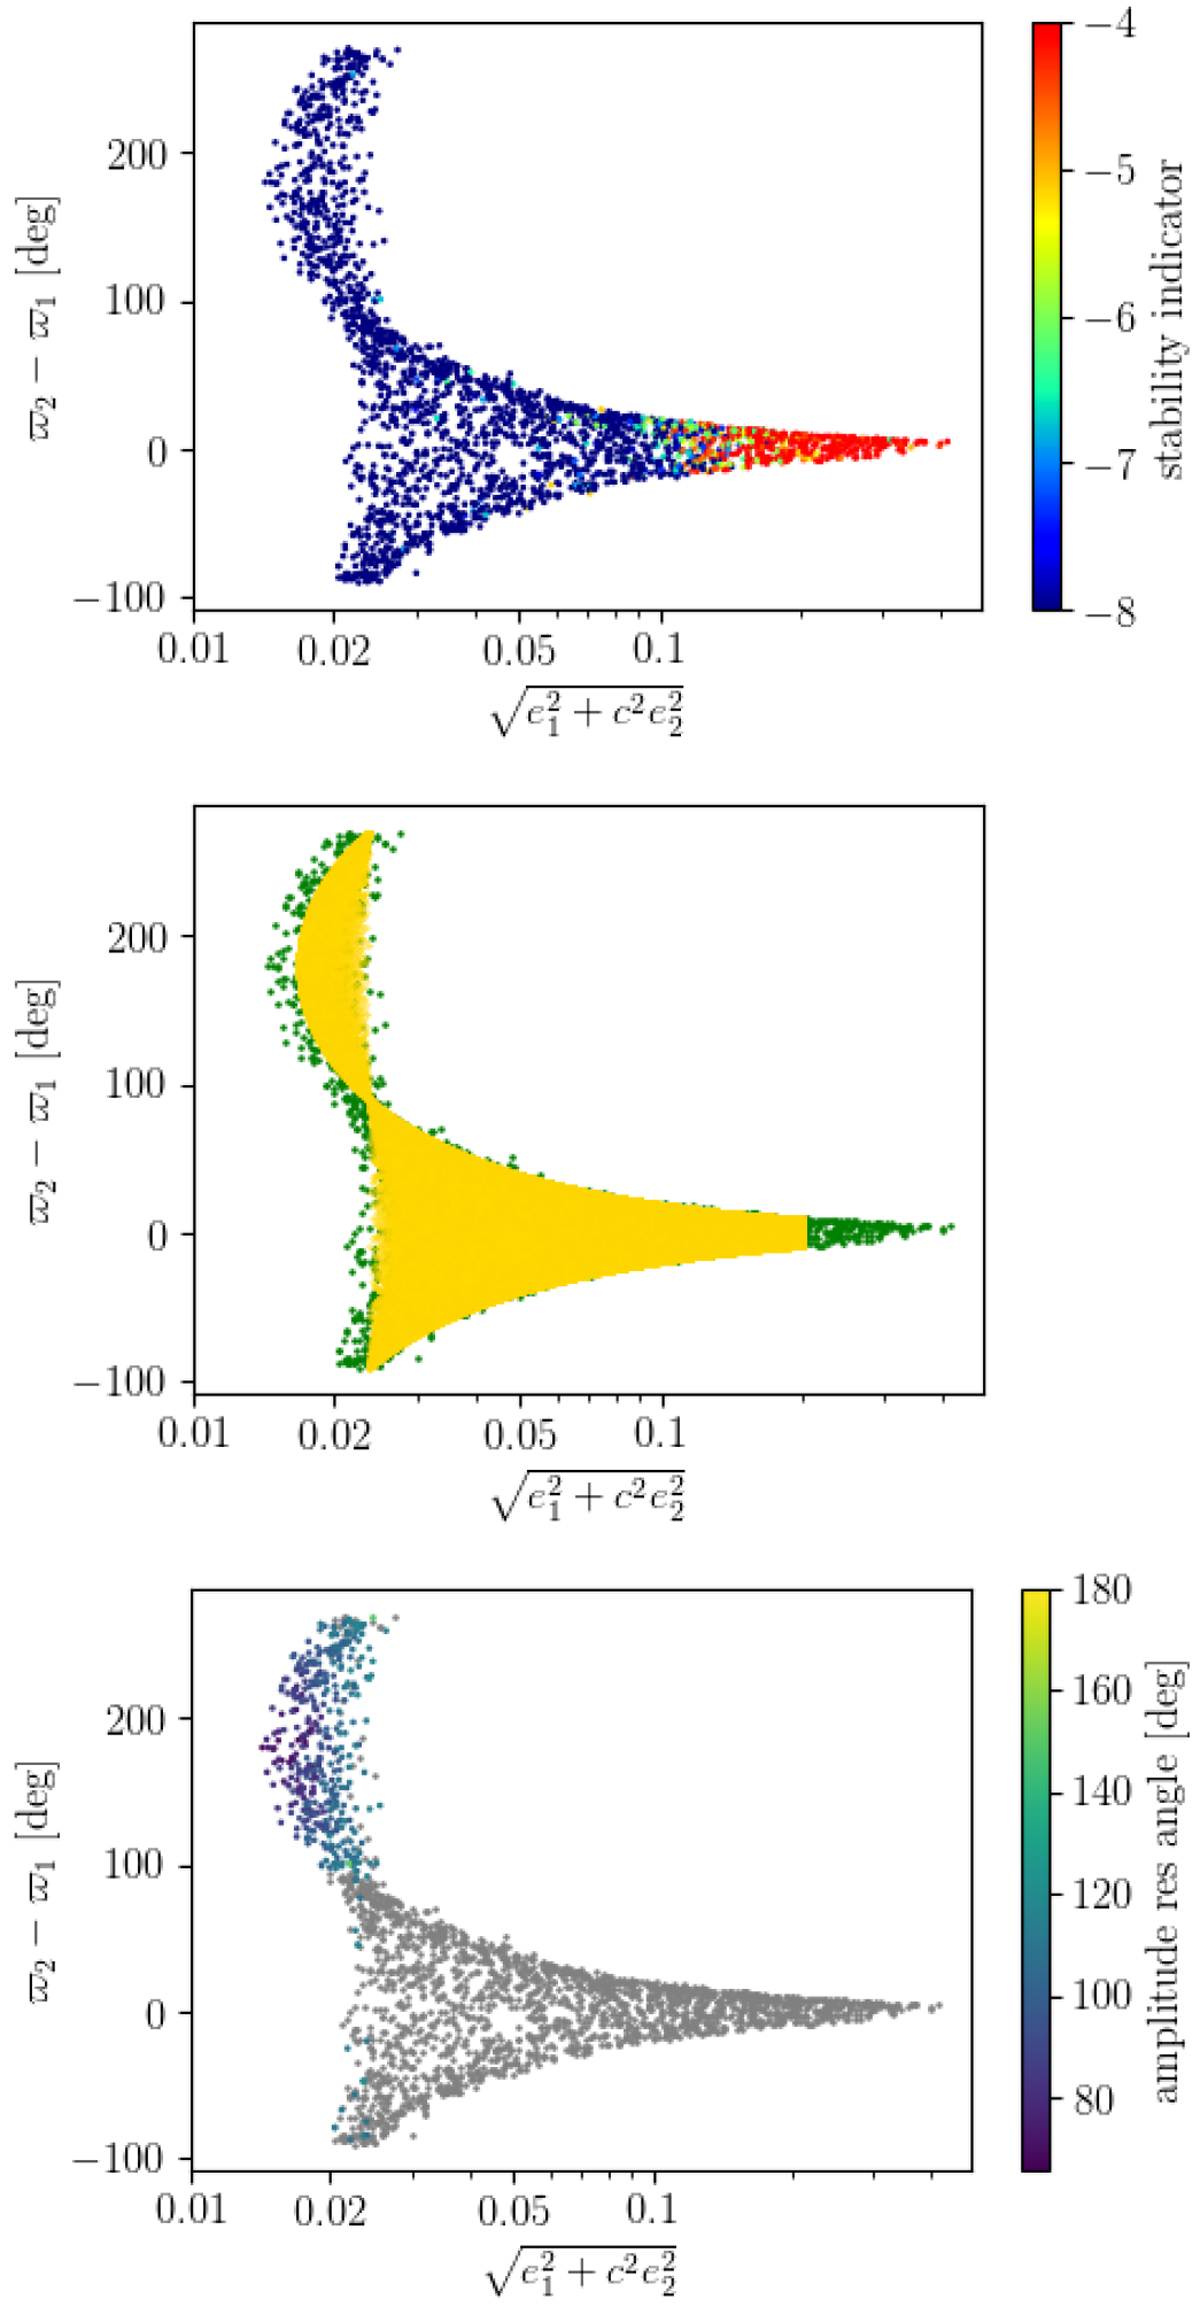
Top:stability of the trajectories integrated from 2300 posterior samples, ranging from stable (blue) to unstable (red). Middle: green dots show the projection of 2300 randomly selected samples of the posterior summarised in Table 2. Gold dots show the theoretical posterior discussed in Sect. 5.2. Bottom: smallest semi-amplitude between the two resonant angles (Eq. (6)). Grey dots indicate a circulation of both of them.
Current usage metrics show cumulative count of Article Views (full-text article views including HTML views, PDF and ePub downloads, according to the available data) and Abstracts Views on Vision4Press platform.
Data correspond to usage on the plateform after 2015. The current usage metrics is available 48-96 hours after online publication and is updated daily on week days.
Initial download of the metrics may take a while.