Fig. 6
Download original image
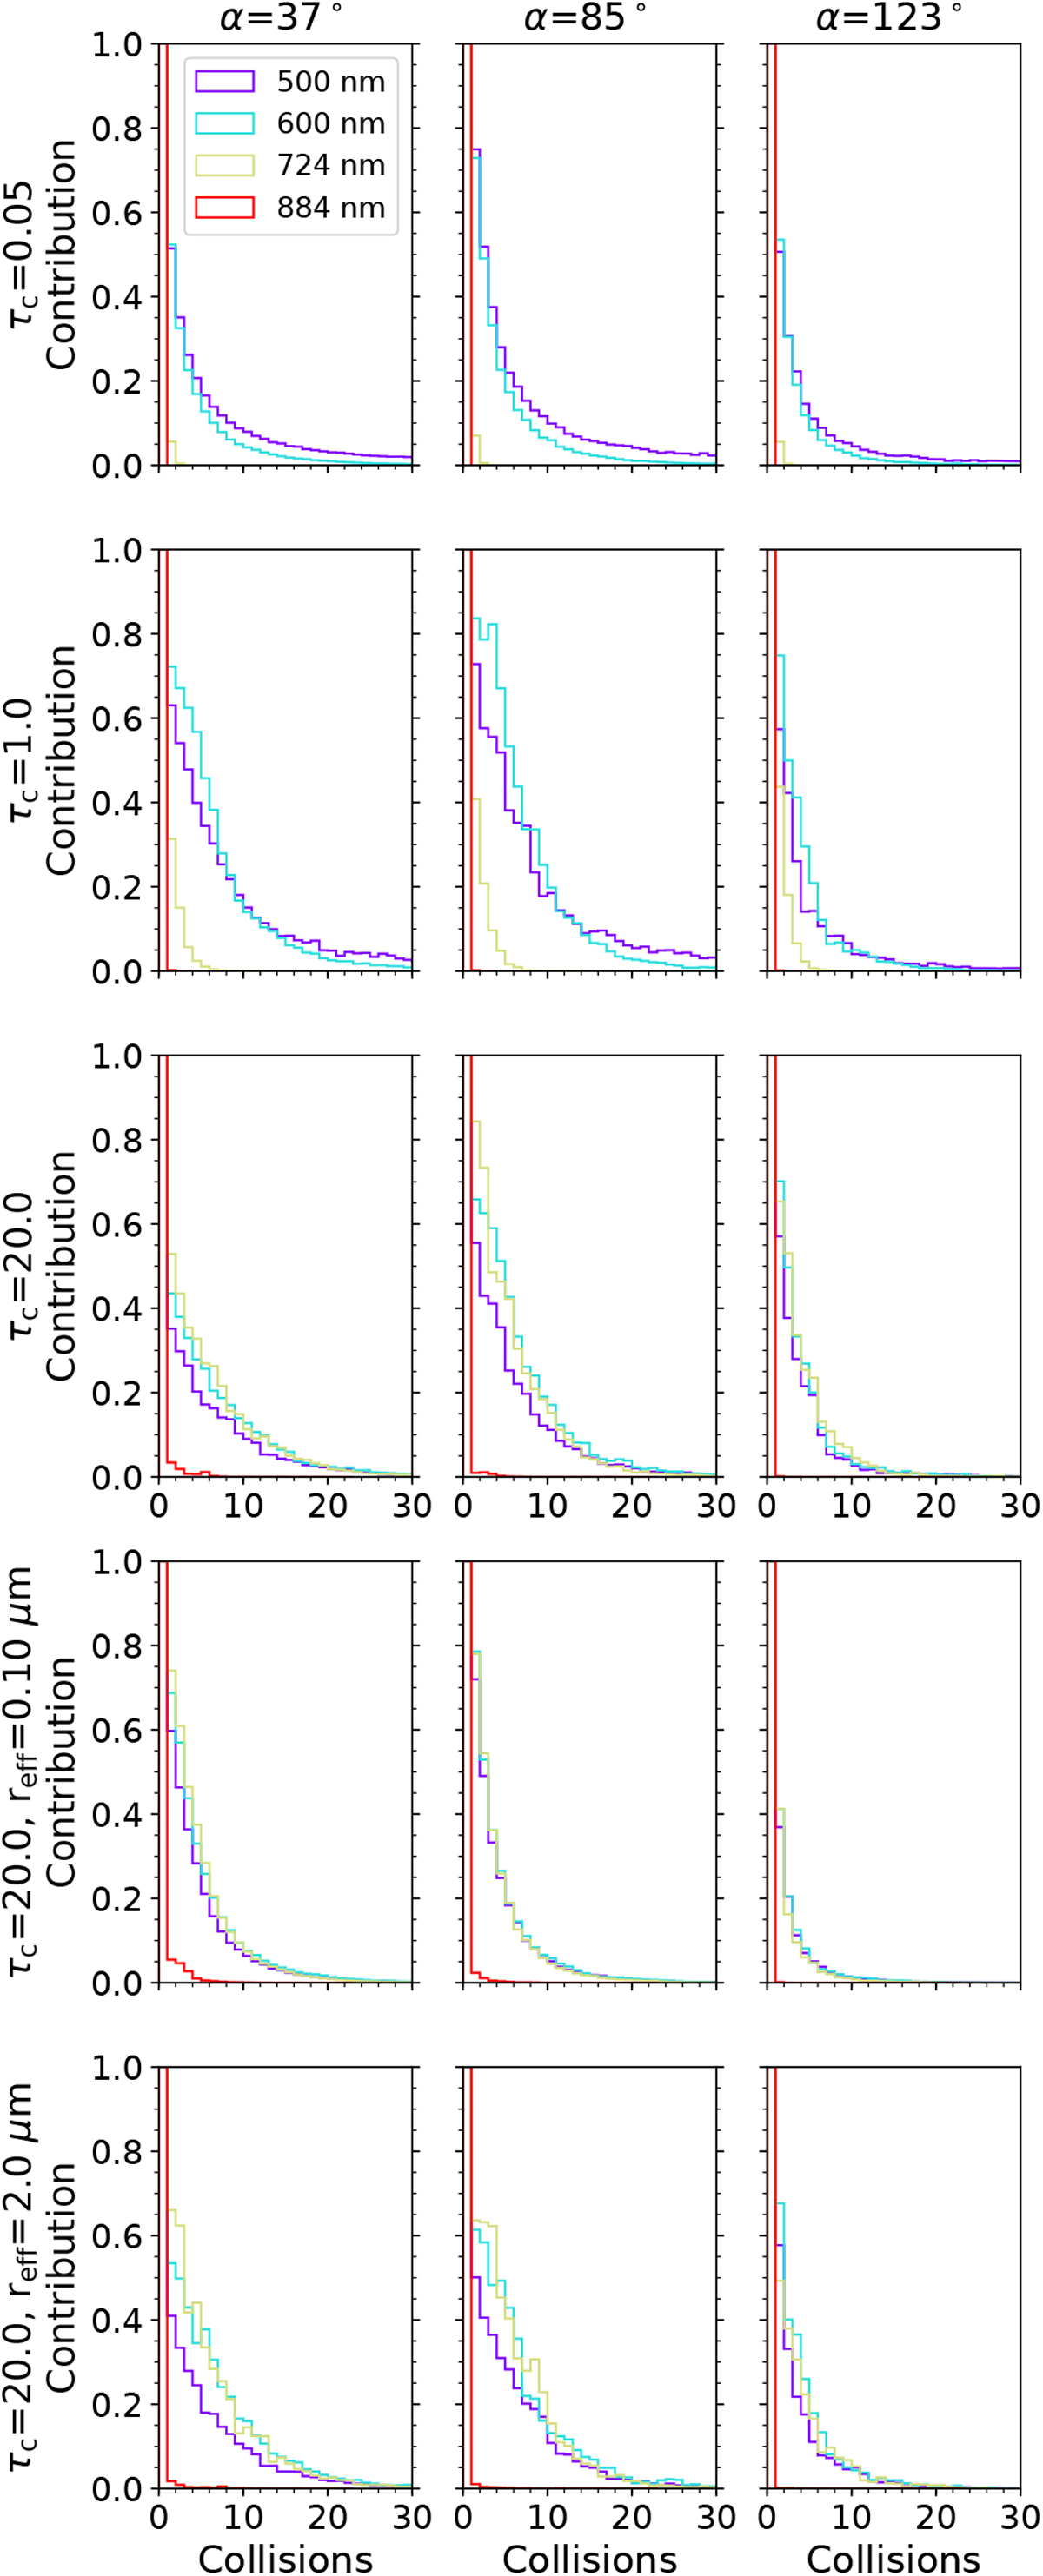
Contribution to the overall spectral brightness of the successive scattering events that the simulated photons undergo in the atmosphere at λ = 500 nm (purple lines), 600 nm (blue lines), 724 nm (yellow lines), and 884 nm (red lines). At each wavelength, the maximum photon contribution to the overall brightness of the spectrum is normalized to 1. Each column corresponds to a phase angle: 37° (left), α = 85° (middle), and α = 123° (right). Each row corresponds to a cloud scenario, as indicated in the labels. Also included are the thick-cloud-scenario retrievals forvalues of reff = 0.10 and 2.0 μm (see Sect. 5.2).
Current usage metrics show cumulative count of Article Views (full-text article views including HTML views, PDF and ePub downloads, according to the available data) and Abstracts Views on Vision4Press platform.
Data correspond to usage on the plateform after 2015. The current usage metrics is available 48-96 hours after online publication and is updated daily on week days.
Initial download of the metrics may take a while.