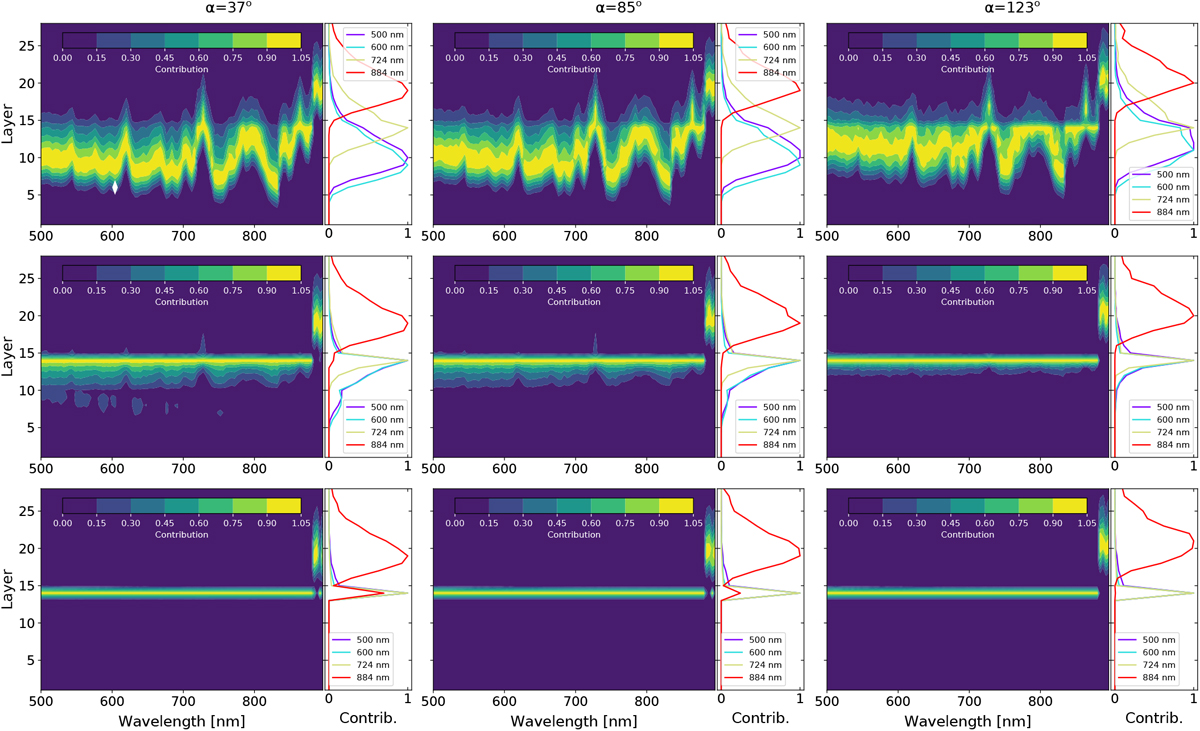
Fig. 5
Download original image
Atmospheric layers probed by the photons in our radiative-transfer computations. Layer 28 is the top of the atmosphere and layer 0 is the bottom (see Carrión-González et al. 2020 for details). Each row corresponds to a cloudscenario. Upper row: no-cloud; middle: thin-cloud; bottom: thick-cloud. Left column: phase angle of 37°; middle: α = 85°,right: α = 123°. The maximum photon contribution at each wavelength is normalized to 1. However, not all wavelengths have comparable absolute contributions to the spectra, as shown in Fig. 1. The right-hand panels of each subplot show the vertical profiles of these normalized photon contributions for a selection of wavelengths: 500 nm (purple lines), 600 nm (blue lines), 724 nm (yellow lines), and 884 nm (red lines).
Current usage metrics show cumulative count of Article Views (full-text article views including HTML views, PDF and ePub downloads, according to the available data) and Abstracts Views on Vision4Press platform.
Data correspond to usage on the plateform after 2015. The current usage metrics is available 48-96 hours after online publication and is updated daily on week days.
Initial download of the metrics may take a while.