Fig. 1
Download original image
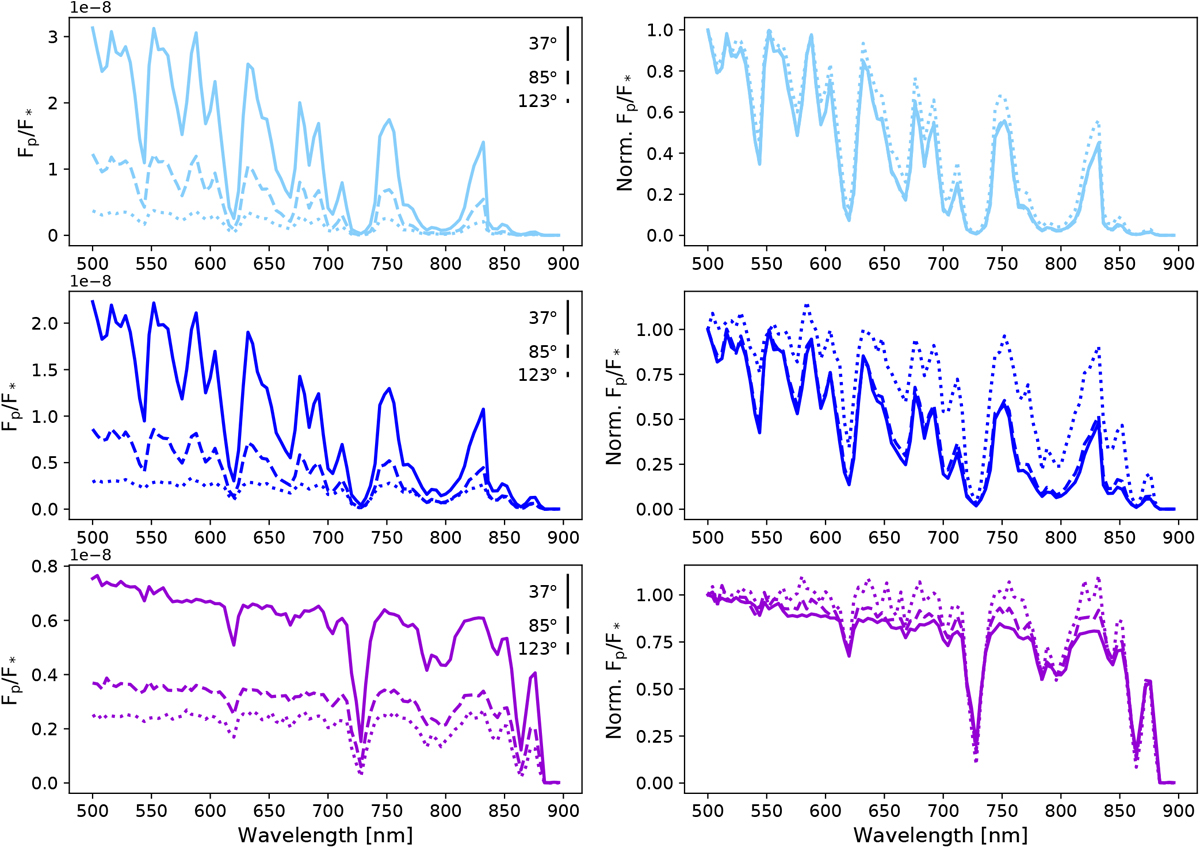
Noiseless synthetic spectra (left column) for the no-cloud (top row and light blue), thin-cloud (middle row and darker blue), and thick-cloud (bottom row and purple) configurations. Solid lines in each subplot correspond to the spectrum at phase angle α = 37°, dashed lines at α = 85°, and dotted lines at α = 123°. The error bars indicated with vertical lines correspond to the noise at S∕N = 10 injected to create the noisy spectrum at each phase angle. Right column: same synthetic spectra but normalised with respect to the value of Fp∕F⋆(λ = 500 nm), revealing the shape changes in the spectra at different phases.
Current usage metrics show cumulative count of Article Views (full-text article views including HTML views, PDF and ePub downloads, according to the available data) and Abstracts Views on Vision4Press platform.
Data correspond to usage on the plateform after 2015. The current usage metrics is available 48-96 hours after online publication and is updated daily on week days.
Initial download of the metrics may take a while.