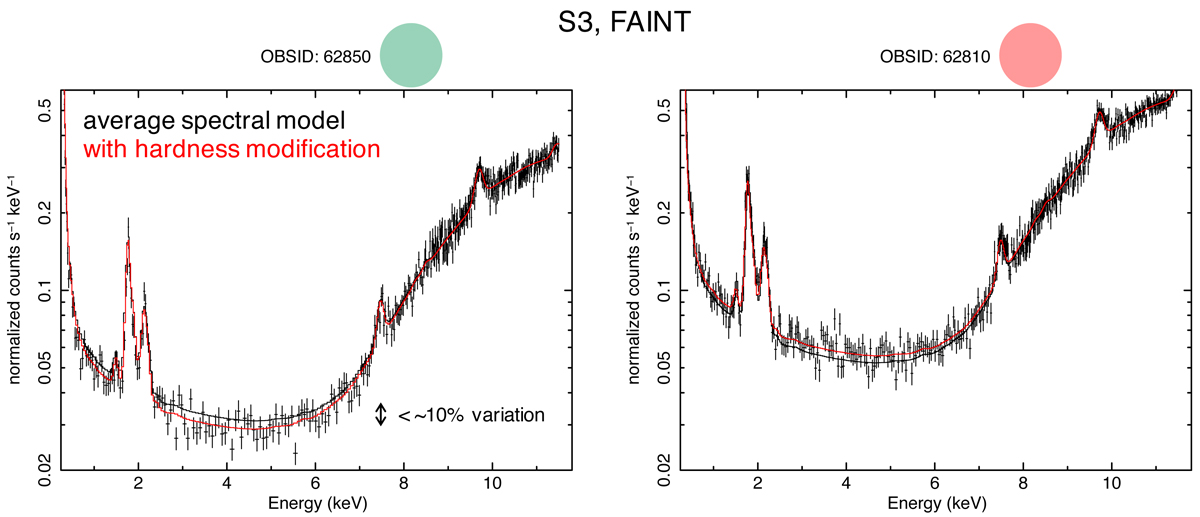
Fig. 9.
Download original image
Example of temporal variation of the particle-induced background spectral shapes. The black crosses represent the data. The black and red solid lines show the average spectral models and the models with the optimized hardness modification. We note that the OBSID 62850 and 62810 show the lowest and highest count rates in the ACIS-stowed observations, respectively.
Current usage metrics show cumulative count of Article Views (full-text article views including HTML views, PDF and ePub downloads, according to the available data) and Abstracts Views on Vision4Press platform.
Data correspond to usage on the plateform after 2015. The current usage metrics is available 48-96 hours after online publication and is updated daily on week days.
Initial download of the metrics may take a while.