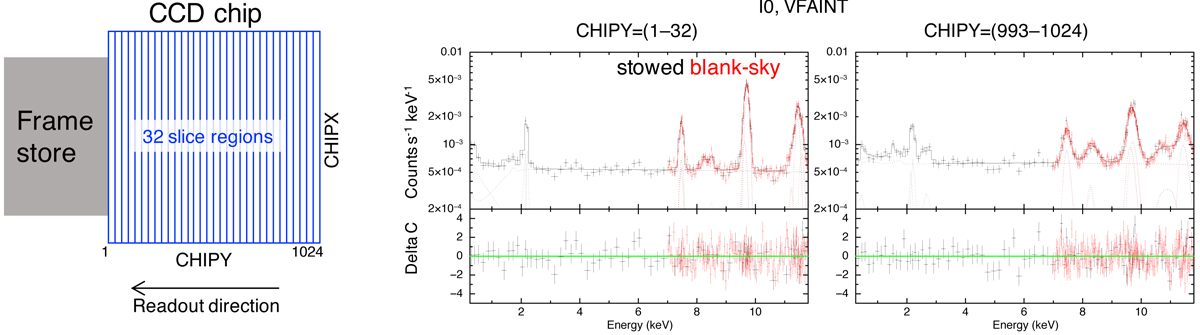
Fig. 7.
Download original image
Example of the spatial variation of the particle-induced background spectra. Two spectra extracted from the low- and high-CHIPY regions of the merged ACIS-stowed data (I0, VFAINT) are presented. Left panel: 32 slice regions along CHIPY. In each of the two right panels, the upper panel presents the data and model fluxes, whereas the lower panel presents their residuals. The black and red crosses represent the ACIS-stowed and CDF-S blank-sky observations, respectively. The solid and dotted lines are the total models and their components, respectively.
Current usage metrics show cumulative count of Article Views (full-text article views including HTML views, PDF and ePub downloads, according to the available data) and Abstracts Views on Vision4Press platform.
Data correspond to usage on the plateform after 2015. The current usage metrics is available 48-96 hours after online publication and is updated daily on week days.
Initial download of the metrics may take a while.