Free Access
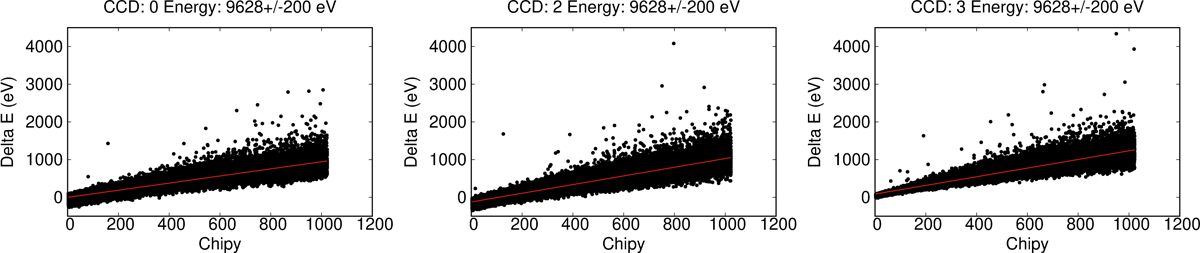
Fig. 6.
Download original image
Scatter plots of events on the CHIPY-ΔE plane for I0 (CCD0), I2 (CCD2), and I3 (CCD3). The events were extracted from the gain-corrected-and-merged ACIS-stowed data in VFAINT mode. The extraction energy range is 9.628 ± 0.2 keV. The red solid lines represent the best-fit linear functions.
Current usage metrics show cumulative count of Article Views (full-text article views including HTML views, PDF and ePub downloads, according to the available data) and Abstracts Views on Vision4Press platform.
Data correspond to usage on the plateform after 2015. The current usage metrics is available 48-96 hours after online publication and is updated daily on week days.
Initial download of the metrics may take a while.