Free Access
Fig. 5.
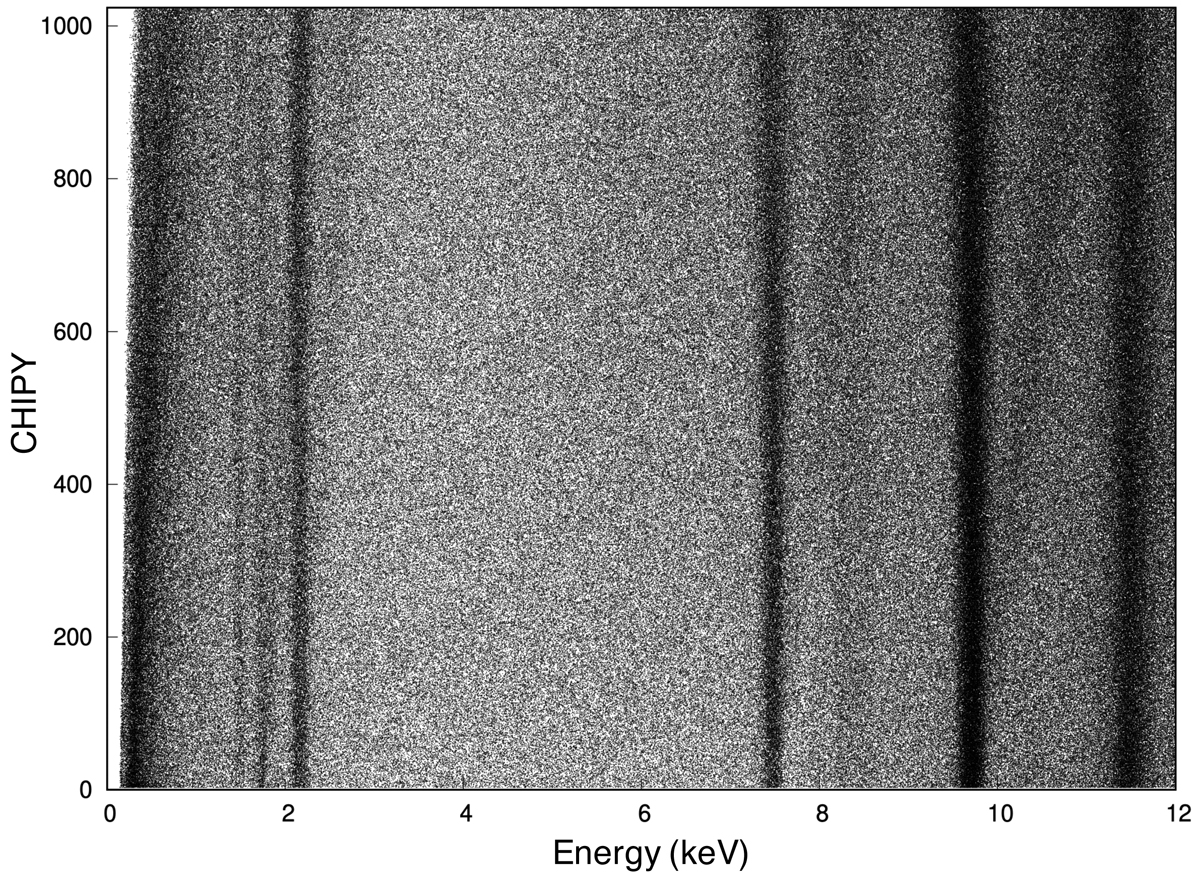
Download original image
Scatter plot of the particle-induced background events on the CHIPY-energy plane extracted from the merged ACIS-stowed data. This is the sum of the I0, I2, and I3 events. Darker regions include larger numbers of events.
Current usage metrics show cumulative count of Article Views (full-text article views including HTML views, PDF and ePub downloads, according to the available data) and Abstracts Views on Vision4Press platform.
Data correspond to usage on the plateform after 2015. The current usage metrics is available 48-96 hours after online publication and is updated daily on week days.
Initial download of the metrics may take a while.