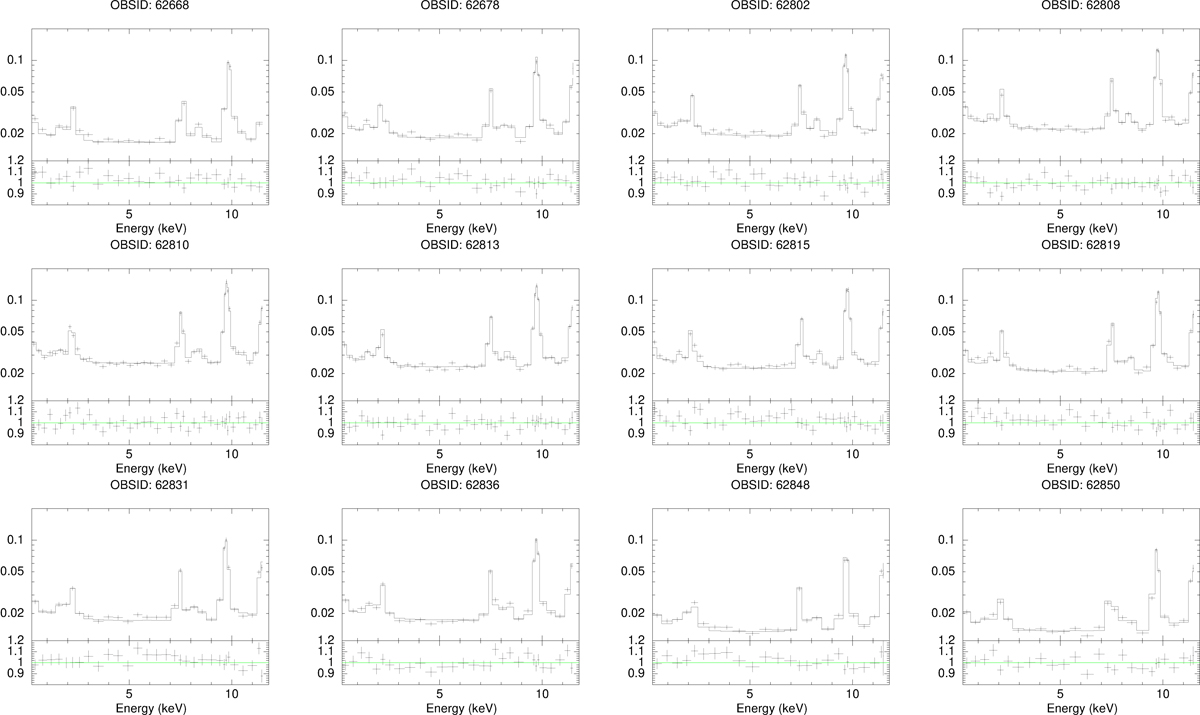
Fig. C.1.
Download original image
Comparison between the individual ACIS-stowed observation spectra and output spectra of mkacispback for ACIS-I0, VFAINT mode. In each case, the spectrum is extracted from the entire CCD. In each panel, the upper and lower panels show the data and model count rates (s−1 keV−1) and their ratios (data/model), respectively. One observation per year from the observation list (Table A.1) is presented. Observations with exposure time of less than 40 ksec are omitted.
Current usage metrics show cumulative count of Article Views (full-text article views including HTML views, PDF and ePub downloads, according to the available data) and Abstracts Views on Vision4Press platform.
Data correspond to usage on the plateform after 2015. The current usage metrics is available 48-96 hours after online publication and is updated daily on week days.
Initial download of the metrics may take a while.